QSBA2018 Exam Details
-
Exam Code
:QSBA2018 -
Exam Name
:Qlik Sense Business Analyst Certification - June 2018 Release -
Certification
:QlikView Certifications -
Vendor
:QlikView -
Total Questions
:50 Q&As -
Last Updated
:Dec 14, 2024
QlikView QSBA2018 Online Questions & Answers
-
Question 1:
A sales department has a pie chart that displays the total amount of sales by city.
Users have requested several changes to the pie chart:
Display the labels in `Red'
Increase the font size of the title
Change the color of the values to `Blue'
Which technique should a business analyst use to meet these requirements?
A. Create a custom theme
B. Develop a widget
C. Change chart properties
D. Use single configurator -
Question 2:
A client wants to see a bar chart with a single measure and three dimensions: Region, Product Category, and Month.
The business analyst creates a bar chart with the measure, Sum(Revenue).
Which final step should the business analyst take to complete the chart?
A. Add Region, Product Category, and Month as three different dimensions
B. Create a single master dimension with Region, Product Category, and Month
C. Add Region as a dimension, add Product Category and Month as alternate dimensions
D. Create a cyclic group with Region, Product Category, and Month as dimensions -
Question 3:
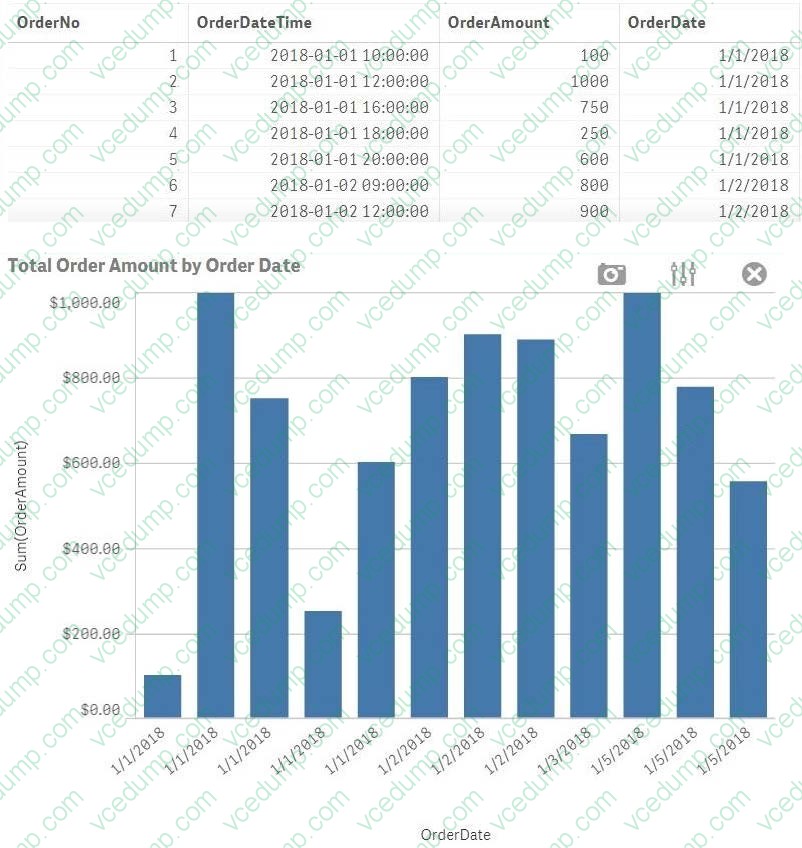
Refer to the exhibits.
A business analyst must create a bar chart to show the total value of orders processed per day. The dataset loaded by the data architect only contains the OrderNo, OrderDateTime, and OrderAmount.
The business analyst creates a calculated field, OrderDate, using the expression, Date(OrderDateTime). The bar chart does NOT present the information correctly.
How should the business analyst fix the error?
A. Change the OrderDate number formatting to `Date' in the properties panel
B. Create a new calculated field for OrderDate with: Date(Floor(OrderDateTime))
C. Change the OrderDate field type to Date' in the format `YYYY-MM-DD' in the data manager.
D. Create a new calculated field for OrderDate with: Date(LTrim(OrderDateTime,10)) -
Question 4:
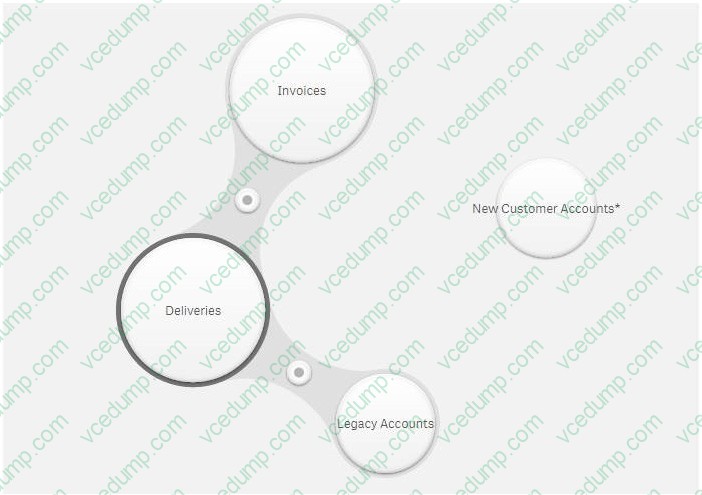
Refer to the exhibit.
A company is starting to use a new customer account system. The business analyst must include this data in an existing app.
Data from the legacy customer account system is already available in the app.
Both tables have similar data, but the columns have different names.
Which actions should the business analyst take to merge data from both systems?
A. 1. Select Legacy Accounts 2. Click Concatenate tables 3. Select New Customer Accounts 4. Map the tables 5. Click Apply
B. 1. Select New Customer Accounts 2. Drag it over Invoices 3. Define the association 4. Click Apply
C. 1. Select Legacy Accounts 2. Click Concatenate tables 3. Select New Customer Accounts 4. Click Sample data 5. Click Apply
D. 1. Select New Customer Accounts 2. Drag it over Legacy Accounts 3. Rename the association 4. Click Apply -
Question 5:
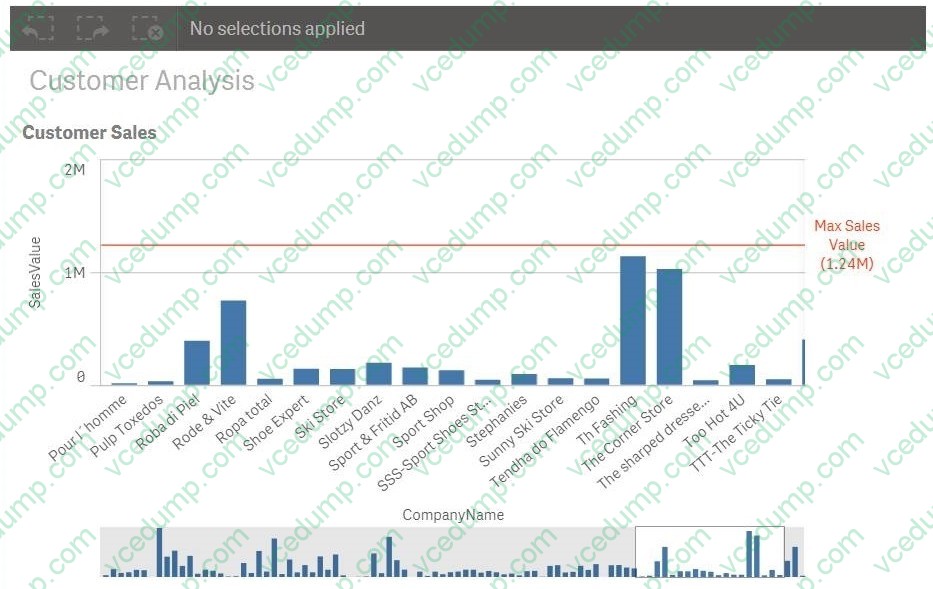
Refer to the exhibit.
A business analyst needs to add a reference line to a bar chart.
Which action should the business analyst take to meet this requirement?
A. Select the Max trend line in the properties panel of the bar chart
B. Create a calculated field in the data manager and use it as a chart expression
C. Create a reference line using Max(Aggr(Sum(Sales),CompanyName))
D. Create a reference line using Aggr(Max(Sum(Sales),CompanyName)) -
Question 6:
A manufacturer uses a dashboard for analysis. Users created many bookmarks to simplify their workflow. An administrator also created some bookmarks in the app based on user feedback.
The organization needs to republish the app and maintain both the users' and administrator's bookmarks.
Which steps should the business analyst take to meet this requirement?
A. Duplicate the app in Work Request bookmark owner to publish bookmark Replace the existing app
B. Duplicate the app in Work Review previous bookmarks Replace the existing published app
C. Review previous bookmarks Copy the app to a new stream Publish the app in the new stream
D. Create a duplicate copy of the app Delete the published app Publish the duplicate app -
Question 7:
A business analyst is building an app for a customer:
The customer wants to be able to: Show row-level transaction details Access an overview of the most important numbers Analyze data
How should the business analyst order the sheets to meet these requirements?
A. 1. Dashboard: sheet for the overview 2. Report: sheet for the row-level details 3. Analysis: sheet for the analysis
B. 1. Analysis: sheet for the analysis 2. Dashboard: sheet for the overview 3. Report: sheet for the row-level details
C. 1. Report: sheet for the row-level details 2. Dashboard: sheet for the overview 3. Analysis: sheet for the analysis
D. 1. Dashboard: sheet for the overview 2. Analysis: sheet for the analysis 3. Report: sheet for the row-level details -
Question 8:
A business analyst needs to make a complex pie chart easier to understand. The pie chart shows the total number of customers by customer type. There are 12 customer types. Some customers do NOT have a type assigned.
The business analyst needs to: Show all customers including those without a customer type See the total number of customers in each customer type
Which two visualizations could the business analyst use to meet these requirements? (Choose two.)
A. Donut
B. Treemap
C. KPI
D. Scatter plot
E. Bar chart -
Question 9:
A CEO of an automotive manufacturing company wants a single dashboard sheet to track the company's sales.
The app must meet several requirements: All charts must be on one sheet Show summary charts of key performance data Ability to scroll up and down the sheet
Which set of actions should the business analyst use to meet these requirement?
A. Use KPI objects Use Insight Advisor
B. Adjust grid spacing Use Insight Advisor
C. Use KPI objects Activate Chart assistance
D. Activate grid spacing Activate Extend sheet -
Question 10:
A marketing team needs to analyze current sales by age groups in a bar chart. The following age groups are created in the data manager, and the field is named AgeGroup:
Children: 16 years old and younger
YoungAdult: 17 to 30 years old
Adult: 31 years old and older
The business analyst will use an expression to set the colors for the bars:
If ([AgeGroup] = `Children', Red(), If ([AgeGroup] = `YoungAdult', Blue(), Green()))
Which steps must be completed to apply the correct colors in the visualization?
A. Select Data in the properties panel and create a calculated dimension using the expression editor.
B. Create a master item dimension using the expression, in the visualization, select Color by dimension and use the newly created master item.
C. Under Appearance in the properties panel, select Color, then select Color by expression, and make sure that The expression is a color code is checked.
D. Create a master item measure using the expression. In the visualization, select Color by measure and use the newly created master item.
Related Exams:
-
QREP
Qlik Replicate Certification -
QSBA2021
Qlik Sense Business Analyst Certification - February 2021 Release -
QSBA2024
Qlik Sense Business Analyst Certification - 2024 -
QSDA2018
Qlik Sense Data Architect Certification - June 2018 Release -
QSDA2019
Qlik Sense Data Architect Certification - June 2019 Release -
QSDA2021
Qlik Sense Data Architect Certification - February 2021 Release -
QSDA2022
Qlik Sense Data Architect Certification - 2022 -
QSDA2024
Qlik Sense Data Architect Certification - 2024 -
QSSA2018
Qlik Sense System Administrator Certification - June 2018 Release -
QV_DEVELOPER_01
QlikView 11 Developer Certification
Tips on How to Prepare for the Exams
Nowadays, the certification exams become more and more important and required by more and more enterprises when applying for a job. But how to prepare for the exam effectively? How to prepare for the exam in a short time with less efforts? How to get a ideal result and how to find the most reliable resources? Here on Vcedump.com, you will find all the answers. Vcedump.com provide not only QlikView exam questions, answers and explanations but also complete assistance on your exam preparation and certification application. If you are confused on your QSBA2018 exam preparations and QlikView certification application, do not hesitate to visit our Vcedump.com to find your solutions here.