PL-300 Exam Details
-
Exam Code
:PL-300 -
Exam Name
:Microsoft Power BI Data Analyst -
Certification
:Microsoft Certifications -
Vendor
:Microsoft -
Total Questions
:546 Q&As -
Last Updated
:Jul 15, 2026
Microsoft PL-300 Online Questions & Answers
-
Question 281:
You publish a dataset to the Power BI service. The dataset contains a connection to an on-premises Microsoft SQL Server database.
You attempt to configure a scheduled refresh but cannot select the appropriate on-premises data gateway.
You confirm the following with the administrator of the gateway:
1. You have the appropriate permissions to use the gateway.
2. The data source was created on the gateway.
3. The gateway has a status of Running.
What is the most likely reason the gateway is unavailable?
A. The type of data source is not supported by the on-premises data gateway.
B. The server name in the PBIX file does not match the data source name in the gateway.
C. The credentials for the data source are invalid.
D. The data source is configured to use single sign-on (SSO). -
Question 282:
You have a Power BI report that uses a dataset based on an Azure Analysis Services live connection.
You need to ensure that users can use Q&A from the Power BI service for the dataset.
What should you do?
A. From the Power BI service, add an enterprise gateway to the dataset.
B. From Power BI Desktop, add synonyms and suggested questions.
C. From Power BI Desktop, add a Q&A visual to the report.
D. From the Power Bi service, select Turn on Q& A for this dataset. -
Question 283:
DRAG DROP
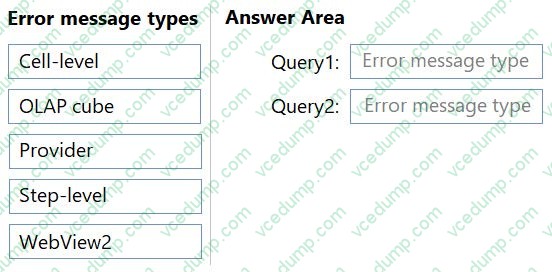
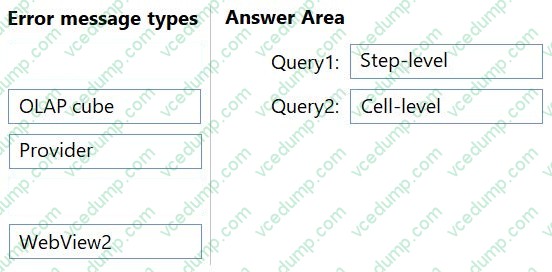
You use Power Query Editor to load two queries named Query1 and Query2.
Query1 results in the following error.

Query2 results in the following error.

Which type of error occurred for each query? To answer, drag the appropriate error types to the correct queries. Each error type may be used once,more than once, or not at all. You may need to drag the split bar between panes or scroll to view content.
NOTE: Each correct selection is worth one point.
Select and Place:
-
Question 284:
You use Power BI Desktop to open a PBIX file that contains a Microsoft Excel data source.
You attempt to refresh the data and receive the following error message.
Expression.Error: The Colum `cost' of the table wasn't found.
What is a possible cause of the error?
A. The Cost column was renamed in the data source.
B. The data in the Cost column cannot be converted into the target data type.
C. The privacy level of the data source does not allow combining the data with other data sources.
D. The source file was moved to a new location. -
Question 285:
Note: This question is part of a series of questions that present the same scenario. Each question in the series contains a unique solution that might meet the stated goals. Some question sets might have more than one correct solution, while others might not have a correct solution.
After you answer a question in this section, you will NOT be able to return to it. As a result, these questions will not appear in the review screen.
You have a data source that contains a column. The column contains case sensitive data.
You have a Power BI semantic model in DirectQuery mode.
You connect to the model and discover that it contains undefined values and errors.
You need to resolve the issue.
Solution: You add an index key and normalize casing in the data source.
Does this meet the goal?
A. Yes
B. No -
Question 286:
HOTSPOT
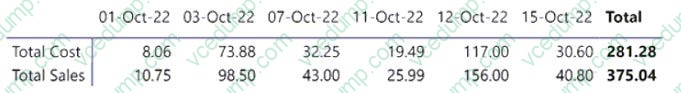
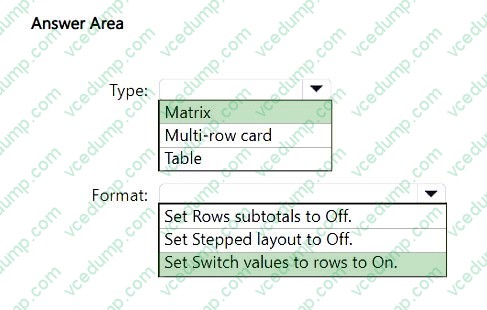
You have a Power BI report that contains the table visual shown in the following exhibit.
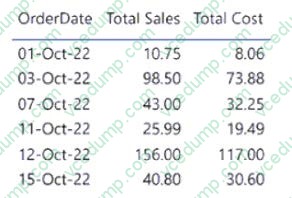
You need to modify the visual to display as shown in the following exhibit.
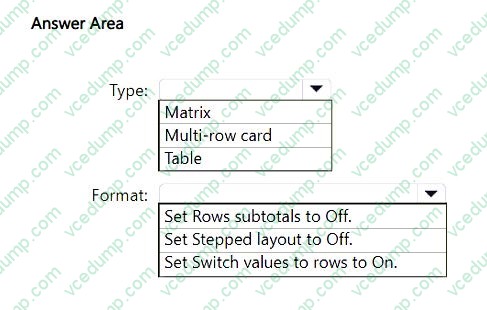
How should you configure the visual? To answer, select the appropriate options in the answer area.
NOTE: Each correct selection is worth one point.
-
Question 287:
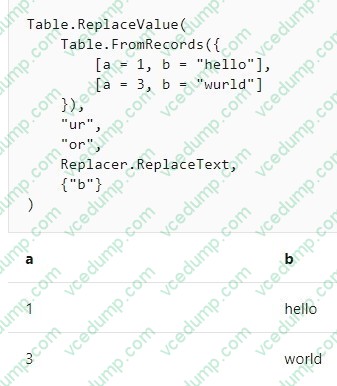
You create the following step by using Power Query Editor.
=Table.ReplaceValue(SalesLT_Address,"1318","1319",Replacer.ReplaceText,{"AddressLine 1"})
A row has a value of 21318 Lasalle Street in the AddressLine1 column.
What will the value be when the step is applied?
A. 1318
B. 1319
C. 21318 Lasalle Street
D. 21319 Lasalle Street -
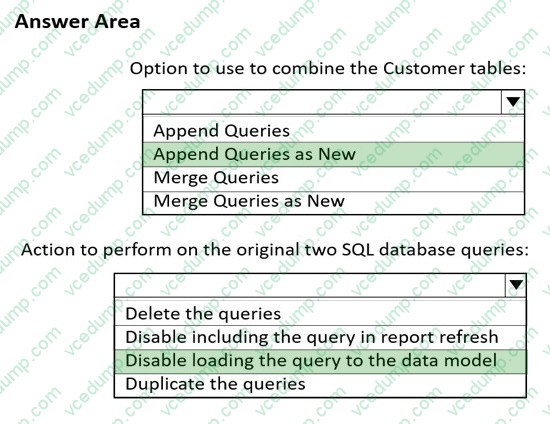
Question 288:
HOTSPOT
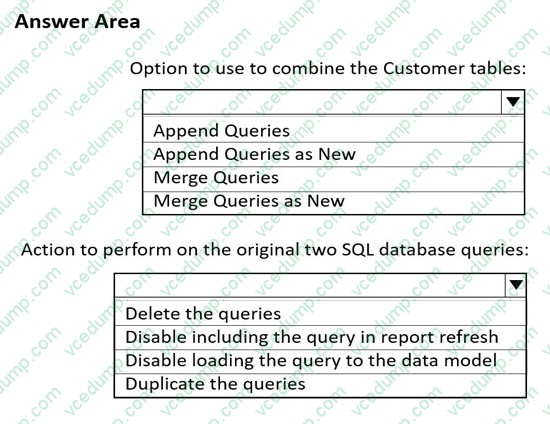
You have two Azure SQL databases that contain the same tables and columns.
For each database, you create a query that retrieves data from a table named Customers.
You need to combine the Customer tables into a single table. The solution must minimize the size of the data model and support scheduled refresh in powerbi.com.
What should you do? To answer, select the appropriate options in the answer area.
NOTE: Each correct selection is worth one point.
-
Question 289:
You have a Power BI report. The report contains a single report page that uses the default theme.
You need to configure the report page to match the formatting shown in the following exhibit.

What should you change on the report page?
A. the wallpaper color only
B. the canvas background color only
C. the wallpaper color and the canvas background color only
D. the canvas background image only -
Question 290:
You create a dashboard by using the Microsoft Power Bl Service. The dashboard contains a card visual that shows total sales from the current year. You grant users access to the dashboard by using the viewer role on the workspace. A user wants to receive daily notifications of the number shown on the card visual. You need to automate the notifications.
What should you do?
A. Share the dashboard to the user.
B. Create a subscription.
C. Create a data alert.
D. Tag the user in a comment.
Related Exams:
-
62-193
Technology Literacy for Educators -
70-243
Administering and Deploying System Center 2012 Configuration Manager -
70-355
Universal Windows Platform – App Data, Services, and Coding Patterns -
77-420
Excel 2013 -
77-427
Excel 2013 Expert Part One -
77-725
Word 2016 Core Document Creation, Collaboration and Communication -
77-726
Word 2016 Expert Creating Documents for Effective Communication -
77-727
Excel 2016 Core Data Analysis, Manipulation, and Presentation -
77-728
Excel 2016 Expert: Interpreting Data for Insights -
77-731
Outlook 2016 Core Communication, Collaboration and Email Skills
Tips on How to Prepare for the Exams
Nowadays, the certification exams become more and more important and required by more and more enterprises when applying for a job. But how to prepare for the exam effectively? How to prepare for the exam in a short time with less efforts? How to get a ideal result and how to find the most reliable resources? Here on Vcedump.com, you will find all the answers. Vcedump.com provide not only Microsoft exam questions, answers and explanations but also complete assistance on your exam preparation and certification application. If you are confused on your PL-300 exam preparations and Microsoft certification application, do not hesitate to visit our Vcedump.com to find your solutions here.