CPIM Exam Details
-
Exam Code
:CPIM -
Exam Name
:Certified in Planning and Inventory Management (CPIM 8.0) -
Certification
:APICS Certifications -
Vendor
:APICS -
Total Questions
:225 Q&As -
Last Updated
:May 25, 2026
APICS CPIM Online Questions & Answers
-
Question 71:
The horizon for forecasts that are input to the sales and operations planning (SandOP) process should be long enough that:
A. cumulative forecast deviation approaches zero.
B. planned product launches can be incorporated.
C. required resources can be properly planned.
D. supply constraints can be resolved. -
Question 72:
Global outsourcing and shared suppliers serving an industry are drivers of which category of risk?
A. Supply disruptions
B. Forecast inaccuracy
C. Procurement problems
D. Loss of intellectual property -
Question 73:
A manufacturer has a primary assembly line supported by output from several subassembly lines. Which of the following scenarios would be the best argument for a multilevel master scheduling process?
A. Low variation in aggregate subassembly demand
B. High variation in aggregate subassembly demand
C. Low variation in subassembly demand mix
D. High variation in subassembly demand mix -
Question 74:
An order winner during the growth stage of a product's life cycle is:
A. variety.
B. availability.
C. dependability.
D. price. -
Question 75:
The ranking of jobs for the dispatch list is created through the application of which of the following priority rule?
A. First come, first served
B. Earliest operation due date
C. Shortest process time
D. All of the above -
Question 76:
In a lean environment, the batch-size decision for planning "A" items would be done by:
A. least total cost.
B. min-max system.
C. lot-for-lot (L4L).
D. periodic order quantity. -
Question 77:
is characterized by many variations in product design, process requirements and order quantities.
A. Flow manufacturing
B. Project manufacturing
C. Intermittent manufacturing
D. None of these -
Question 78:
Based on the values reported in the table below, what is the inventory turnover?
A. 0.50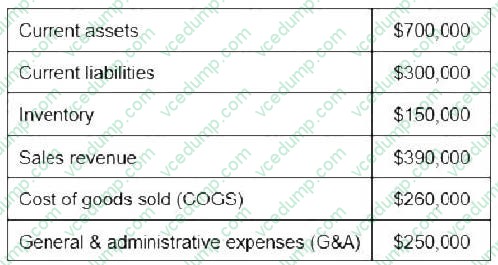
B. 0.58
C. 1.73
D. 2.60 -
Question 79:
At the MRP planning level, the process of priority plans must be checked against available capacity is called
A. Master Production schedule (MPS)
B. Capacity Requirements planning (CRP)
C. Production activity control (PAC)
D. Manufacturing Planning and control function (MPC) -
Question 80:
The master schedule is an Important tool in the sales and operations planning (SandOP) process because it:
A. represents the forecast before changes are made in SandOP.
B. represents the forecast with less detail.
C. balances supply and demand at the product mix level.
D. balances supply and demand at the sales volume level.
Related Exams:
-
CLTD
Certified in Logistics, Transportation and Distribution -
CPIM
Certified in Planning and Inventory Management (CPIM 8.0) -
CPIM-BSP
CPIM - Basics of Supply Chain Management -
CPIM-ECO
CPIM - Execution and Control of Operations -
CPIM-MPR
CIPM - Master Planning of Resources -
CPIM-PART-2
CIPM - (Part 2) -
CSCP
Certified Supply Chain Professional -
CTSC
Certified in Transformation for Supply Chain (CTSC)
Tips on How to Prepare for the Exams
Nowadays, the certification exams become more and more important and required by more and more enterprises when applying for a job. But how to prepare for the exam effectively? How to prepare for the exam in a short time with less efforts? How to get a ideal result and how to find the most reliable resources? Here on Vcedump.com, you will find all the answers. Vcedump.com provide not only APICS exam questions, answers and explanations but also complete assistance on your exam preparation and certification application. If you are confused on your CPIM exam preparations and APICS certification application, do not hesitate to visit our Vcedump.com to find your solutions here.