Exam Details
Exam Code
:DS-200Exam Name
:Data Science EssentialsCertification
:Cloudera CertificationsVendor
:ClouderaTotal Questions
:60 Q&AsLast Updated
:Jul 08, 2025
Cloudera Cloudera Certifications DS-200 Questions & Answers
-
Question 21:
Refer to the exhibit.
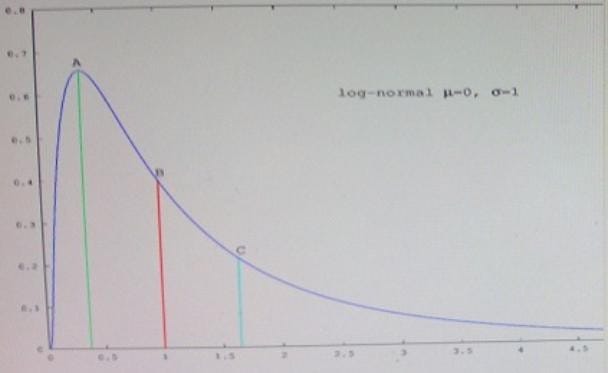
Which point in the figure is the mean?
A. A
B. B
C. C
-
Question 22:
Under what two conditions does stochastic gradient descent outperform 2nd-order optimization techniques such as iteratively reweighted least squares?
A. When the volume of input data is so large and diverse that a 2nd-order optimization technique can be fit to a sample of the data
B. When the model's estimates must be updated in real-time in order to account for new observations.
C. When the input data can easily fit into memory on a single machine, but we want to calculate confidence intervals for all of the parameters in the model.
D. When we are required to find the parameters that return the optimal value of the objective function.
-
Question 23:
What is the result of the following command (the database username is foo and password is bar)?
$ sqoop list-tables - - connect jdbc : mysql : / / localhost/databasename - - table - - username foo - - password bar
A. sqoop lists only those tables in the specified MySql database that have not already been imported into FDFS
B. sqoop returns an error
C. sqoop lists the available tables from the database
D. sqoop imports all the tables from SQL HDFS
-
Question 24:
What is the most common reason for a k-means clustering algorithm to returns a sub-optimal clustering of its input?
A. Non-negative values for the distance function
B. Input data set is too large
C. Non-normal distribution of the input data
D. Poor selection of the initial controls
-
Question 25:
There are 20 patients with acute lymphoblastic leukemia (ALL) and 32 patients with acute myeloid leukemia (AML), both variants of a blood cancer.
The makeup of the groups as follows:
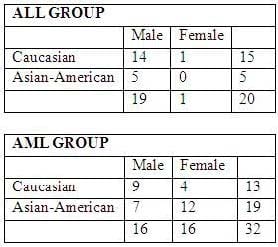
Each individual has an expression value for each of 10000 different genes. The expression value for each gene is a continuous value between -1 and 1.
You've built your model for discriminating between AML and ALL patients and you find that it works quite well on your current data. One month later, a collaboration tells you she has fresh data from 100 new AML/ ALL patients. You run the samples through your model, and turns out your model has very poor predictive accuracy on the new samples; specifically, your model predicts that all males have ALL. What is the most reliable way to fix this problem?
A. Change the distance metric
B. Reduce the number of dimensions
C. Use a Gibbs sampler on a Bayesian network
D. Perform matched sampling across other provided variables
-
Question 26:
There are 20 patients with acute lymphoblastic leukemia (ALL) and 32 patients with acute myeloid leukemia (AML), both variants of a blood cancer.
The makeup of the groups as follows:
Each individual has an expression value for each of 10000 different genes. The expression value for each gene is a continuous value between -1 and 1.
You want to use the data from the 52 patients in the scenario to improve the ability of doctors being able to distinguish between ALL and AML. What type of data science problem is this?
A. Classification
B. Regression
C. Clustering
D. Filtering
-
Question 27:
There are 20 patients with acute lymphoblastic leukemia (ALL) and 32 patients with acute myeloid leukemia (AML), both variants of a blood cancer.
The makeup of the groups as follows: Each individual has an expression value for each of 10000 different genes. The expression value for each gene is a continuous value between -1 and 1.
With which type of plot can you encode the most amount of the data visually?
A. A heat map sorting the individuals by group
B. A histogram of the expression values
C. A scatter plot of two largest principal components
-
Question 28:
There are 20 patients with acute lymphoblastic leukemia (ALL) and 32 patients with acute myeloid leukemia (AML), both variants of a blood cancer.
The makeup of the groups as follows:
Each individual has an expression value for each of 10000 different genes. The expression value for each
gene is a continuous value between -1 and 1.
With which type of plot can you encode the most amount of the data visually?
Rather than use all 10,000 features to separate AML from ALL, you pick a small subnet of features to
separate them optimally. You feature vectors have 10,000 dimensions while you only have 52 data points. You use cross-validation to test your chosen set of features. What three methods will choose the features in an optimal way?
A. Singular value Decomposition
B. Bootstrapping
C. Markov chain Monte Carlo
D. Hidden Markov
E. Bayesian Information Criterion
F. Mutual Information
-
Question 29:
There are 20 patients with acute lymphoblastic leukemia (ALL) and 32 patients with acute myeloid leukemia (AML), both variants of a blood cancer.
The makeup of the groups as follows:
Each individual has an expression value for each of 10000 different genes. The expression value for each gene is a continuous value between -1 and 1.
With which type of plot can you encode the most amount of the data visually?
You choose to perform agglomerative hierarchical clustering on the 10,000 features. How much RAM do you need to hold the distance Matrix, assuming each distance value is 64-bit double?
A. ~ 800 MB
B. ~ 400 MB
C. ~ 160 KB
D. ~ 4 MB
-
Question 30:
You have a large m x n data matrix M. You decide you want to perform dimension reduction/clustering on your data and have decide to use the singular value decomposition (SVD; also called principal components analysis PCA)
You performed singular value decomposition (SVD; also called principal components analysis or PCA) on you data matrix but you did not center your data first. What does your first singular component describe?
A. The mean of the data set
B. The variance of the data set
C. The standard deviation of the data set
D. The maximum of the data set
E. The median of the data set
Related Exams:
CCA-175
Cloudera Certified Administrator Spark and Hadoop DeveloperCCA-410
Cloudera Certified Administrator for Apache Hadoop CDH4CCA-470
Cloudera Certified Administrator for Apache Hadoop CDH4 Upgrade Exam (CCAH)CCA-500
Cloudera Certified Administrator for Apache Hadoop (CCAH)CCA-505
Cloudera Certified Administrator for Apache Hadoop (CCAH) CDH5 Upgrade ExamCCB-400
Cloudera Certified Specialist in Apache HBaseCCD-410
Cloudera Certified Developer for Apache Hadoop (CCDH)CCD-470
Cloudera Certified Developer for Apache Hadoop CDH4 Upgrade (CCDH)
Tips on How to Prepare for the Exams
Nowadays, the certification exams become more and more important and required by more and more enterprises when applying for a job. But how to prepare for the exam effectively? How to prepare for the exam in a short time with less efforts? How to get a ideal result and how to find the most reliable resources? Here on Vcedump.com, you will find all the answers. Vcedump.com provide not only Cloudera exam questions, answers and explanations but also complete assistance on your exam preparation and certification application. If you are confused on your DS-200 exam preparations and Cloudera certification application, do not hesitate to visit our Vcedump.com to find your solutions here.