Exam Details
Exam Code
:CLSSBBExam Name
:Certified Lean Six Sigma Black Belt (LSSBB)Certification
:Six Sigma CertificationsVendor
:Six SigmaTotal Questions
:639 Q&AsLast Updated
:May 05, 2025
Six Sigma Six Sigma Certifications CLSSBB Questions & Answers
-
Question 331:
If = 0.5, what is the critical value?
A. 2.365
B. 2.306
C. 1.860
D. 1.895
-
Question 332:
A control chart is to be used to display the number of non-conducting diodes. Each point on the chart represent the number of bad diodes in a box of 1000. The appropriate control chart to use is:
A. x-bar and R
B. median
C. individual and moving range
D. p
E. np
F. u
G. c
-
Question 333:
Find the average difference dbar.
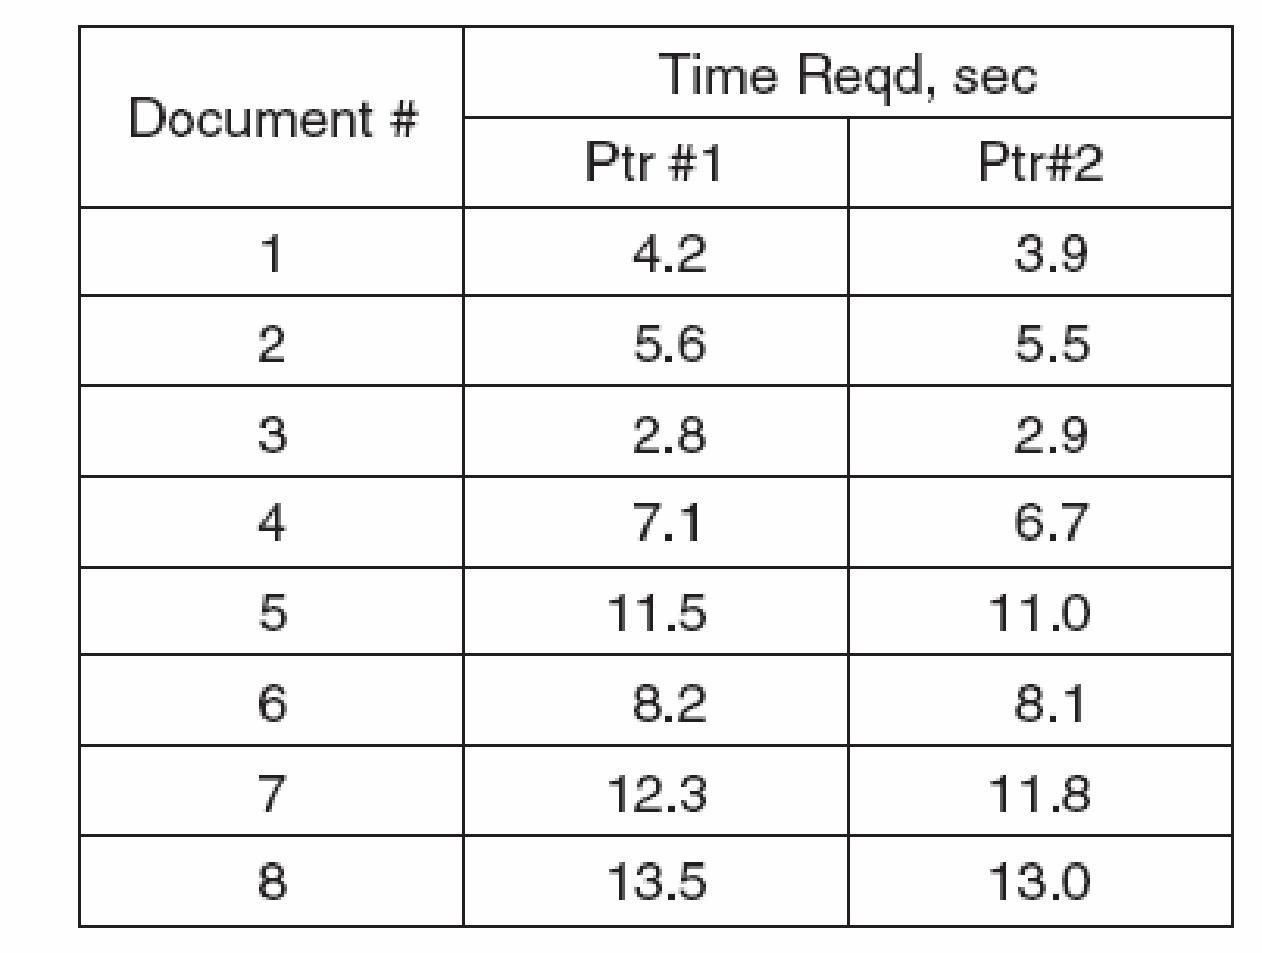
A. 0.2875
B. 0.3502
C. 0.2714
D. 0.2295
-
Question 334:
If it is desirable to maximize the response R, the following levels should be used:
A. A+ and B+
B. A+ and B
-
Question 335:

A control chart will be used to monitor the number of scratches on a product. The following data have been collected: The appropriate control chart to use is:
A. x-bar and R
B. median
C. individual and moving range
D. p
E. np
F. u G. c
-
Question 336:
The temperature in a storage location is logged once every 30 minutes. The control chart that is appropriate for displaying these values is:
A. x-bar and R
B. median
C. individual and moving range
D. p
E. np
F. u
G. c
-
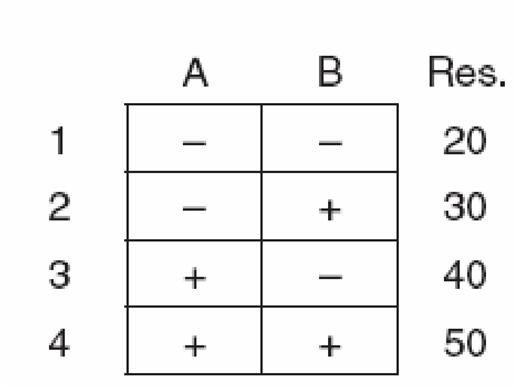
Question 337:
Calculate the interaction effect:
A. 20
B. 25
C. 30
D. 40
E. none of the above
F. Answer Pending
-
Question 338:
Find the value of m or b1:
A. 0.25
B. 0.63
C. 0.75
D. 1.22
-
Question 339:
Find the value of b or b0:
A. 3.33
B. ?.33
C. 4.08
D. ?.08
E. 1.24
F. ?.24
-
Question 340:
Calculate the main effect of factor A:
A. 20
B. 25
C. 30
D. 40
E. none of the above
Related Exams:
Tips on How to Prepare for the Exams
Nowadays, the certification exams become more and more important and required by more and more enterprises when applying for a job. But how to prepare for the exam effectively? How to prepare for the exam in a short time with less efforts? How to get a ideal result and how to find the most reliable resources? Here on Vcedump.com, you will find all the answers. Vcedump.com provide not only Six Sigma exam questions, answers and explanations but also complete assistance on your exam preparation and certification application. If you are confused on your CLSSBB exam preparations and Six Sigma certification application, do not hesitate to visit our Vcedump.com to find your solutions here.