Q2
Single choice
A data analyst was asked to create a chart that shows the relationship between study hours and exam scores for each student using the data sets in the table below:
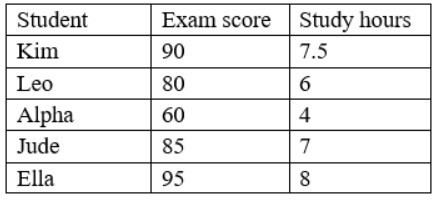
Which of the following charts would BEST represent the relationship between the variables?