Q43
Lab
Simulation
Use Minitab to construct a run chart and a histogram from this data set.
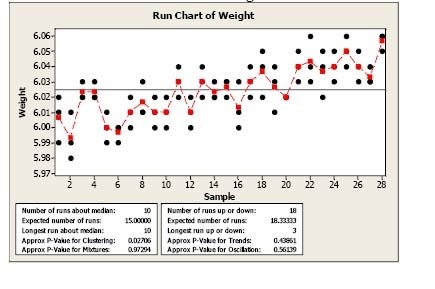
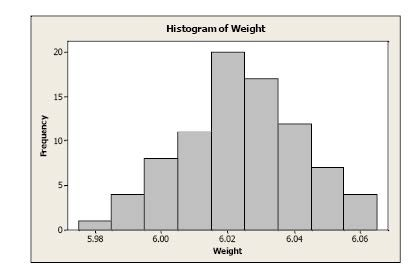
Interpret the charts.
What conclusions about the distribution of the weights can you reach based on these charts?
Not auto-scored - compare your configuration against the model answer.