Q4
Lab
Simulation
Project 7 of 7: Farmers Market
Overview
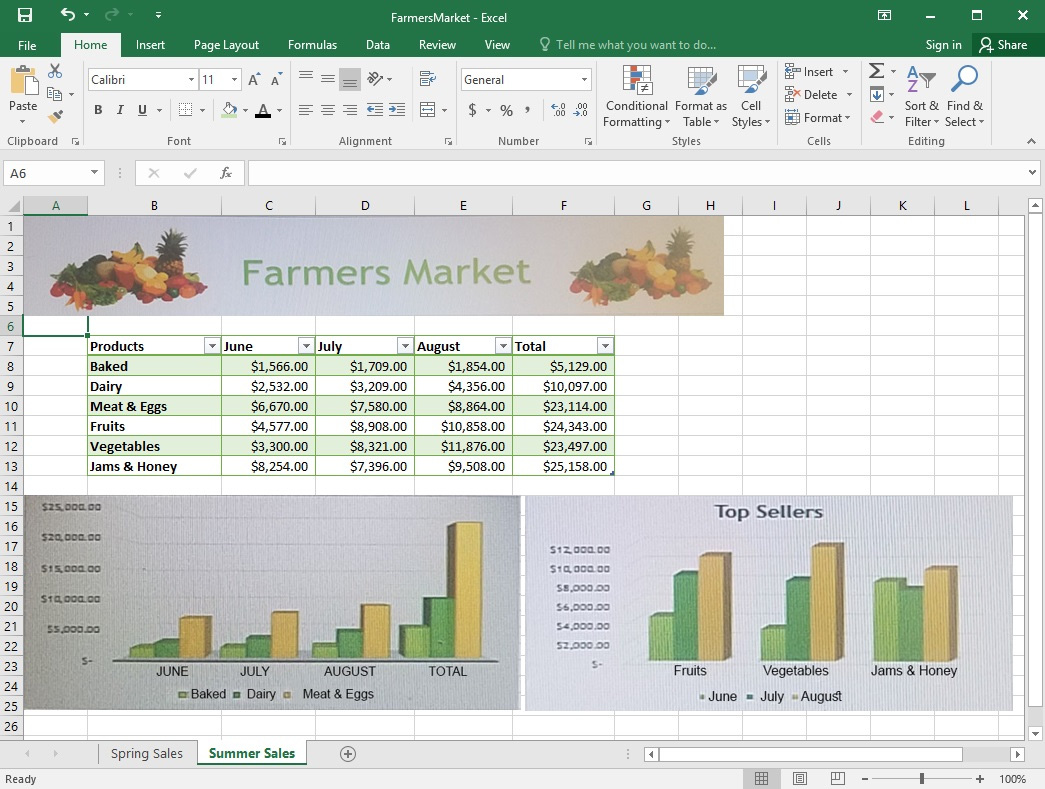
You are the Director of a local farmers' market. You are creating and modifying charts for a report which shows the amounts and variety of products sold during the season.
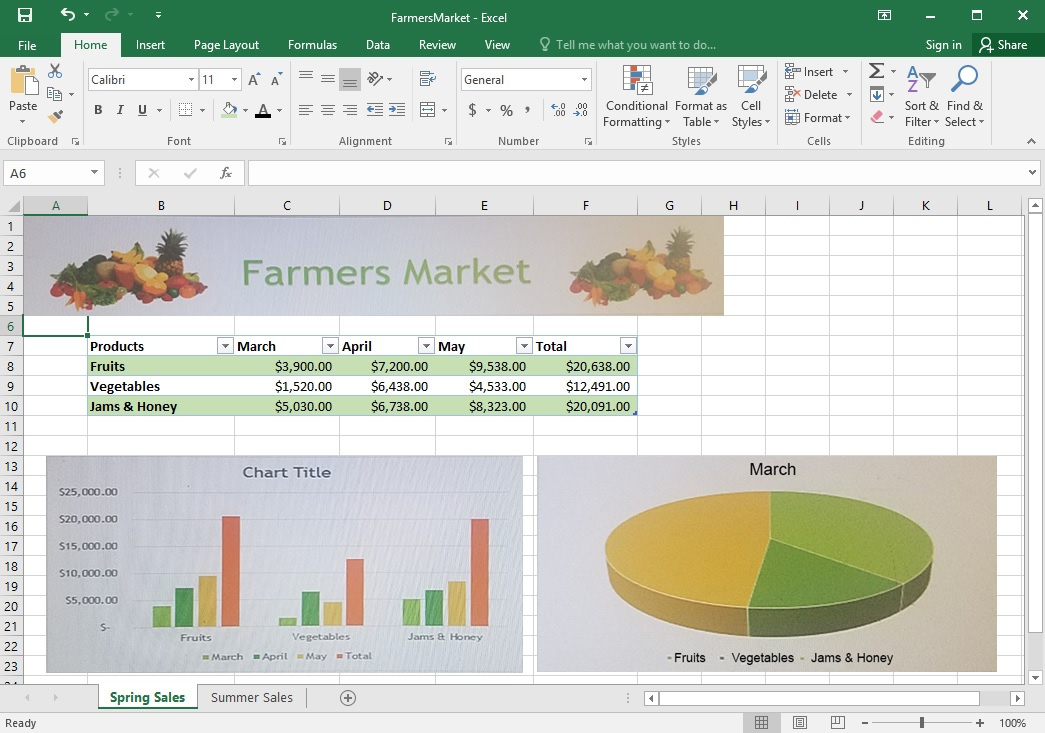
On the "Spring Sales" worksheet, add the title "New Products" to the column chart. Label the vertical axis
"Gross Sales" and the horizontal axis "Months".
Not auto-scored - compare your configuration against the model answer.