What constitutes a single metrics time series (MTS)?
-
A
A series of timestamps that all reflect the same metric.
-
B
A set of data points that all have the same metric name and list of dimensions.
-
C
A set of data points that use different dimensions but the same metric name.
-
D
A set of metrics that are ordered in series based on timestamp.
Reveal answer details
Close answer details
Correct answerB
ExplanationThe correct answer is B. A set of data points that all have the same metric name and list of dimensions.
A metric time series (MTS) is a collection of data points that have the same metric and the same set of dimensions. For example, the following sets of data points are in three separate MTS:
MTS: Gauge metric cpu.utilization, dimension "hostname": "host" MTS: Gauge metric cpu.utilization, dimension "hostname": "host" MTS: Gauge metric memory.usage, dimension "hostname": "host"
A metric is a numerical measurement that varies over time, such as CPU utilization or memory usage. A dimension is a key-value pair that provides additional information about the metric, such as the hostname or the location. A data point is a combination of a metric, a dimension, a value, and a timestamp
What information is needed to create a detector?
-
A
Alert Status, Alert Criteria, Alert Settings, Alert Message, Alert Recipients
-
B
Alert Signal, Alert Criteria, Alert Settings, Alert Message, Alert Recipients
-
C
Alert Signal, Alert Condition, Alert Settings, Alert Message, Alert Recipients
-
D
Alert Status, Alert Condition, Alert Settings, Alert Meaning, Alert Recipients
Reveal answer details
Close answer details
Correct answerC
ExplanationAccording to the Splunk Observability Cloud documentation1, to create a detector, you need the following information: Alert Signal: This is the metric or dimension that you want to monitor and alert on. You can select a signal from a chart or a dashboard, or enter a SignalFlow query to define the signal.
Alert Condition: This is the criteria that determines when an alert is triggered or cleared. You can choose from various built-in alert conditions, such as static threshold, dynamic threshold, outlier, missing data, and so on. You can also specify the severity level and the trigger sensitivity for each alert condition. Alert Settings: This is the configuration that determines how the detector behaves and interacts with other detectors. You can set the detector name, description, resolution, run lag, max delay, and detector rules.
You can also enable or disable the detector, and mute or unmute the alerts.
Alert Message: This is the text that appears in the alert notification and event feed. You can customize the alert message with variables, such as signal name, value, condition, severity, and so on. You can also use markdown formatting to enhance the message appearance.
Alert Recipients: This is the list of destinations where you want to send the alert notifications. You can choose from various channels, such as email, Slack, PagerDuty, webhook, and so on. You can also specify the notification frequency and suppression settings.
Given that the metric demo. trans.
count is being sent at a 10 second native resolution, which of the following is an accurate description of the data markers displayed in the chart below? 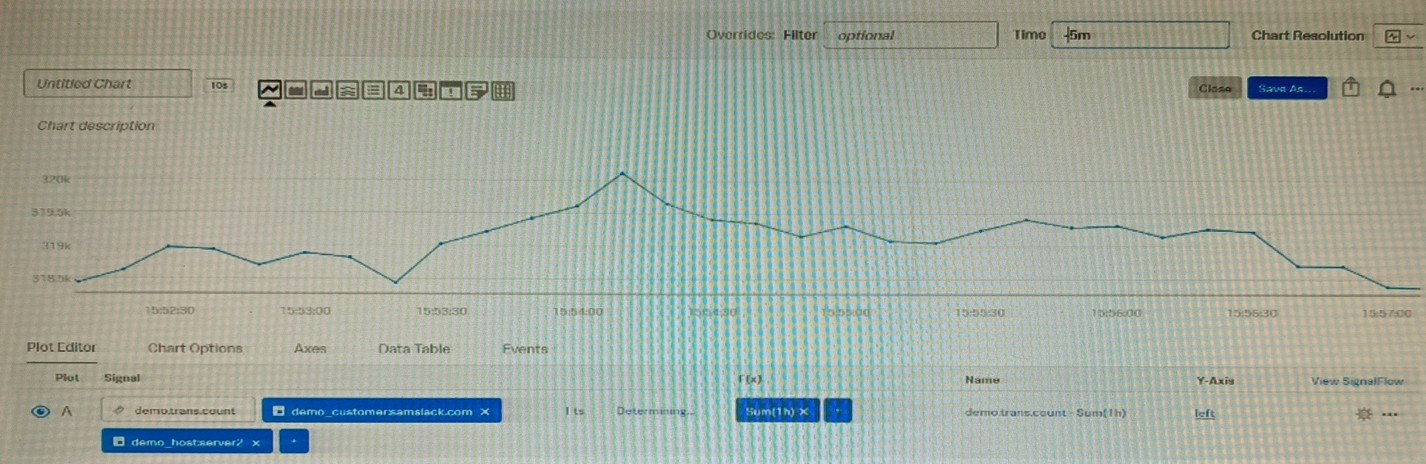
-
A
Each data marker represents the average hourly rate of API calls.
-
B
Each data marker represents the 10 second delta between counter values.
-
C
Each data marker represents the average of the sum of datapoints over the last minute, averaged over the hour.
-
D
Each data marker represents the sum of API calls in the hour leading up to the data marker.
Reveal answer details
Close answer details
Correct answerD
ExplanationThe correct answer is D. Each data marker represents the sum of API calls in the hour leading up to the data marker.
The metric demo.trans.count is a cumulative counter metric, which means that it represents the total number of API calls since the start of the measurement. A cumulative counter metric can be used to measure the rate of change or the sum of events over a time period1 The chart below shows the metric demo.trans.count with a one-hour rollup and a line chart type. A rollup is a way to aggregate data points over a specified time interval, such as one hour, to reduce the number of data points displayed on a chart.
A line chart type connects the data points with a line to show the trend of the metric over time Each data marker on the chart represents the sum of API calls in the hour leading up to the data marker. This is because the rollup function for cumulative counter metrics is sum by default, which means that it adds up all the data points in each time interval. For example, the data marker at 10:00 AM shows the sum of API calls from 9:00 AM to 10:00 AM To learn more about how to use metrics and charts in Splunk Observability Cloud, you can refer to these documentations.
https://docs.splunk.com/Observability/gdi/metrics/metrics.html#Metric-types
https://docs.splunk.com/Observability/gdi/metrics/charts.html#Data-resolution-and-rollups-
in-charts
https://docs.splunk.com/Observability/gdi/metrics/charts.html#Rollup-functions-
for-metric-types
The Sum Aggregation option for analytic functions does which of the following?
-
A
Calculates the number of MTS present in the plot.
-
B
Calculates 1/2 of the values present in the input time series.
-
C
Calculates the sum of values present in the input time series across the entire environment or per group.
-
D
Calculates the sum of values per time series across a period of time.
Reveal answer details
Close answer details
Correct answerC
ExplanationAccording to the Splunk Test Blueprint - O11y Cloud Metrics User document1, one of the metrics concepts that is covered in the exam is analytic functions. Analytic functions are mathematical operations that can be applied to metrics to transform, aggregate, or analyze them.
The Splunk O11y Cloud Certified Metrics User Track document2 states that one of the recommended courses for preparing for the exam is Introduction to Splunk Infrastructure Monitoring, which covers the basics of metrics monitoring and visualization. In the Introduction to Splunk Infrastructure Monitoring course, there is a section on Analytic Functions, which explains that analytic functions can be used to perform calculations on metrics, such as sum, average, min, max, count, etc. The document also provides examples of how to use analytic functions in charts and dashboards. One of the analytic functions that can be used is Sum Aggregation, which calculates the sum of values present in the input time series across the entire environment or per group. The document gives an example of how to use Sum Aggregation to calculate the total CPU usage across all hosts in a group by using the following syntax: sum(cpu.utilization) by hostgroup
Which of the following is optional, but highly recommended to include in a datapoint?
-
A
-
B
-
C
-
D
Reveal answer details
Close answer details
Correct answerD
ExplanationThe correct answer is D. Metric type. A metric type is an optional, but highly recommended field that specifies the kind of measurement that a datapoint represents. For example, a metric type can be gauge, counter, cumulative counter, or histogram. A metric type helps Splunk Observability Cloud to interpret and display the data correctly
To learn more about how to send metrics to Splunk Observability Cloud, you can refer to this documentation.
https://docs.splunk.com/Observability/gdi/metrics/metrics.html#Metric-types
https://docs.splunk.com/Observability/gdi/metrics/metrics.html
Question 6
Multiple choice
Which of the following are true about organization metrics? (select all that apply)
-
A
Organization metrics give insights into system usage, system limits, data ingested and token quotas.
-
B
Organization metrics count towards custom MTS limits.
-
C
Organization metrics are included for free.
-
D
A user can plot and alert on them like metrics they send to Splunk Observability Cloud.
Reveal answer details
Close answer details
Correct answersA, C, D
ExplanationThe correct answer is A, C, and D. Organization metrics give insights into system usage, system limits, data ingested and token quotas. Organization metrics are included for free. A user can plot and alert on them like metrics they send to Splunk Observability Cloud.
Organization metrics are a set of metrics that Splunk Observability Cloud provides to help you measure your organization's usage of the platform. They include metrics such as: Ingest metrics: Measure the data you're sending to Infrastructure Monitoring, such as the number of data
points you've sent.
App usage metrics: Measure your use of application features, such as the number of dashboards in your organization.
Integration metrics: Measure your use of cloud services integrated with your organization, such as the number of calls to the AWS CloudWatch API. Resource metrics: Measure your use of resources that you can specify limits for, such as the number of custom metric time series (MTS) you've created1
Organization metrics are not charged and do not count against any system limits. You can view them in built-in charts on the Organization Overview page or in custom charts using the Metric Finder. You can also create alerts based on organization metrics to monitor your usage and performance
To learn more about how to use organization metrics in Splunk Observability Cloud, you can refer to this documentation.
https://docs.splunk.com/observability/admin/org-metrics.html
Which component of the OpenTelemetry Collector allows for the modification of metadata?
-
A
-
B
-
C
-
D
Reveal answer details
Close answer details
Correct answerA
ExplanationThe component of the OpenTelemetry Collector that allows for the modification of metadata is A.
Processors.
Processors are components that can modify the telemetry data before sending it to exporters or other components. Processors can perform various transformations on metrics, traces, and logs, such as filtering, adding, deleting, or updating attributes, labels, or resources. Processors can also enrich the telemetry data with additional metadata from various sources, such as Kubernetes, environment variables, or system information For example, one of the processors that can modify metadata is the attributes processor. This processor can update, insert, delete, or replace existing attributes on metrics or traces.
Attributes are key-value pairs that provide additional information about the telemetry data, such as the service name, the host name, or the span kind Another example is the resource processor. This processor can modify resource attributes on metrics or traces. Resource attributes are key-value pairs that describe the entity that produced the telemetry data, such as the cloud provider, the region, or the instance type3 To learn more about how to use processors in the OpenTelemetry Collector, you can refer to this documentation.
https://opentelemetry.io/docs/collector/configuration/#processors
https://github.com/open-telemetry/opentelemetry-collector-contrib/tree/main/processor/attributesprocessor
https://github.com/open-telemetry/opentelemetry-collector-contrib/tree/main/processor/resourceprocessor
A customer has a very dynamic infrastructure.
During every deployment, all existing instances are destroyed, and new ones are created Given this deployment model, how should a detector be created that will not send false notifications of instances being down?
-
A
Create the detector. Select Alert settings, then select Auto-Clear Alerts and enter an appropriate time period.
-
B
Create the detector. Select Alert settings, then select Ephemeral Infrastructure and enter the expected lifetime of an instance.
-
C
Check the Dynamic checkbox when creating the detector.
-
D
Check the Ephemeral checkbox when creating the detector.
Reveal answer details
Close answer details
Correct answerB
ExplanationAccording to the web search results, ephemeral infrastructure is a term that describes instances that are auto-scaled up or down, or are brought up with new code versions and discarded or recycled when the next code version is deployed 1. Splunk Observability Cloud has a feature that allows you to create detectors for ephemeral infrastructure without sending false notifications of instances being down. To use this feature, you need to do the following steps: Create the detector as usual, by selecting the metric or dimension that you want to monitor and alert on, and choosing the alert condition and severity level. Select Alert settings, then select Ephemeral Infrastructure. This will enable a special mode for the detector that will automatically clear alerts for instances that are expected to be terminated.
Enter the expected lifetime of an instance in minutes. This is the maximum amount of time that an instance is expected to live before being replaced by a new one. For example, if your instances are replaced every hour, you can enter 60 minutes as the expected lifetime.
Save the detector and activate it.
With this feature, the detector will only trigger alerts when an instance stops reporting a metric unexpectedly, based on its expected lifetime. If an instance stops reporting a metric within its expected lifetime, the detector will assume that it was terminated on purpose and will not trigger an alert. Therefore, option B is correct.
Question 9
Multiple choice
Which of the following are required in the configuration of a data point? (select all that apply)
-
A
-
B
-
C
-
D
Reveal answer details
Close answer details
Correct answersA, C, D
ExplanationThe required components in the configuration of a data point are: Metric Name: A metric name is a string that identifies the type of measurement that the data point represents, such as cpu.utilization, memory.usage, or response.time. A metric name is mandatory for every data point, and it must be unique within a Splunk Observability Cloud organization1 Timestamp: A timestamp is a numerical value that indicates the time at which the data point was collected or generated. A timestamp is mandatory for every data point, and it must be in epoch time format, which is the number of
seconds since January, 1970 UTC
Value: A value is a numerical value that indicates the magnitude or quantity of the measurement that the data point represents. A value is mandatory for every data point, and it must be compatible with the metric type of the data point Therefore, the correct answer is A, C, and D.
To learn more about how to configure data points in Splunk Observability Cloud, you can refer to this documentation.
https://docs.splunk.com/Observability/gdi/metrics/metrics.html#Data-points
|