Preview real exam questions, verified answers and available explanations before choosing a study plan.
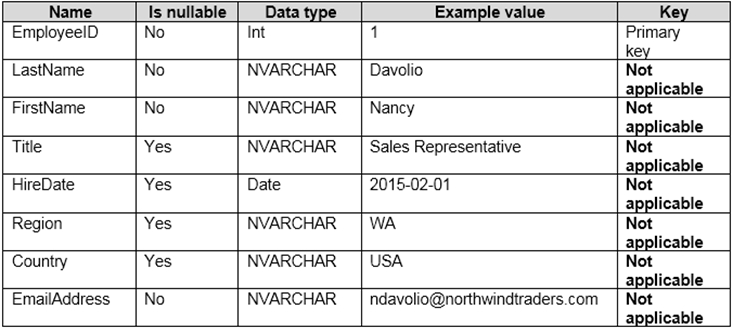
Question 1
Hotspot
HOTSPOT
You are profiling data by using Power Query Editor.
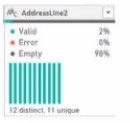
The AddressLine2 column in a table named Address is shown in the following exhibit.
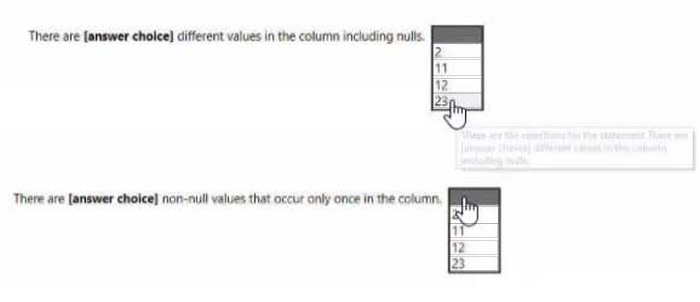
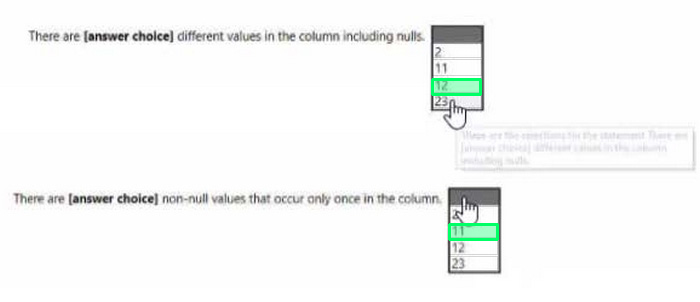
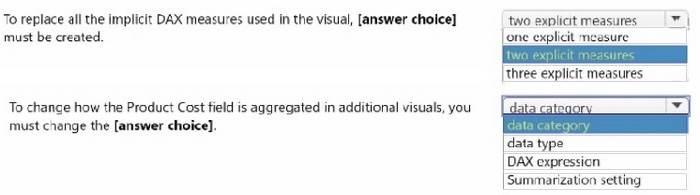
Use the drop-down menus to select the answer choice that completes each statement based on the information presented in the graphic.
NOTE: Each correct selection is worth one point.
Reveal answer detailsClose answer details
Question 2
Hotspot
HOTSPOT
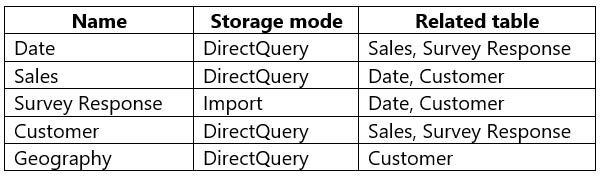
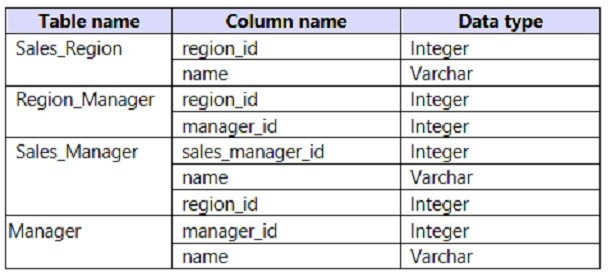
You have a Power BI semantic model that contains the following tables.
All the tables use the same data source.
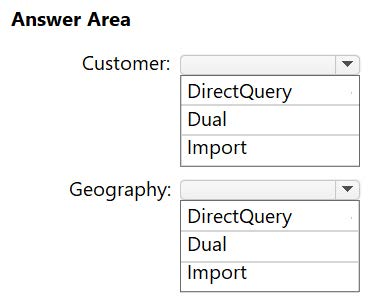
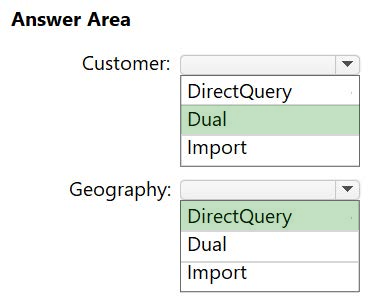
You need to reduce the number of limited relationships in the model by changing the storage mode of certain tables. The solution must NOT affect the latency of the data.
Which storage mode should you select for the Customer and Geography tables? To answer, select the appropriate options in the answer area.
NOTE: Each correct selection is worth one point.
Reveal answer detailsClose answer details
Question 3
Single choice
You have a Power 81 semantic model that contains a table named Table1. Table1 runs in Import storage mode.
You need to update the model to change the storage mode of Table1 to DirectQuery.
What should you do?
A
Delete Table1. and then add the table to the model again in DirectQuery storage mode.
B
From Power Query Editor, duplicate the query for Table1.
C
From Model view, change the storage mode of Table1 to DirectQuery
D
Add an aggregation table to the model.
Reveal answer detailsClose answer details
Correct answerC
Question 4
Hotspot
HOTSPOT
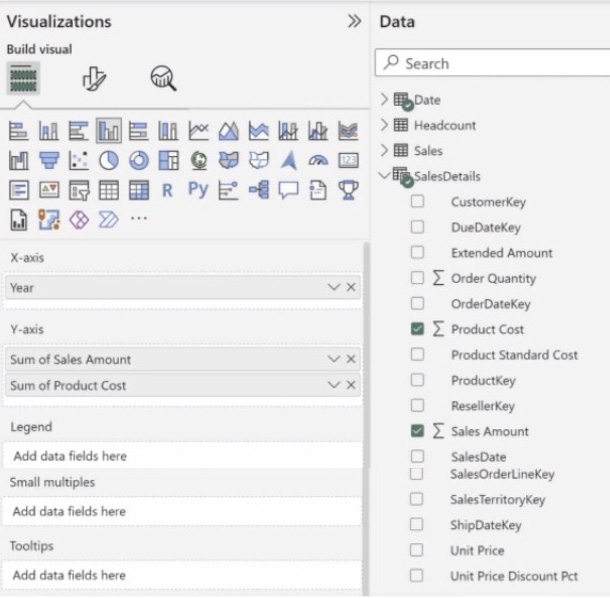
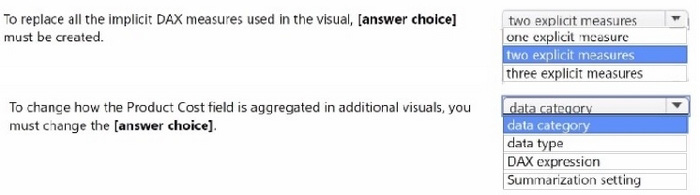
You have a Power B1 report that contains the fields shown in the following exhibit.
Use the drop-down menus to select the answer choice that completes each statement based on the
information presented in the graphic.
NOTE: Each correct selection is worth one point.
Reveal answer detailsClose answer details
Question 5
Single choice
You have a semantic model named Model1.
You need to ensure that users can verify that the data in Model1 meets corporate standards.
What should you do?
A
Create an image of Model1.
B
Promote Model1.
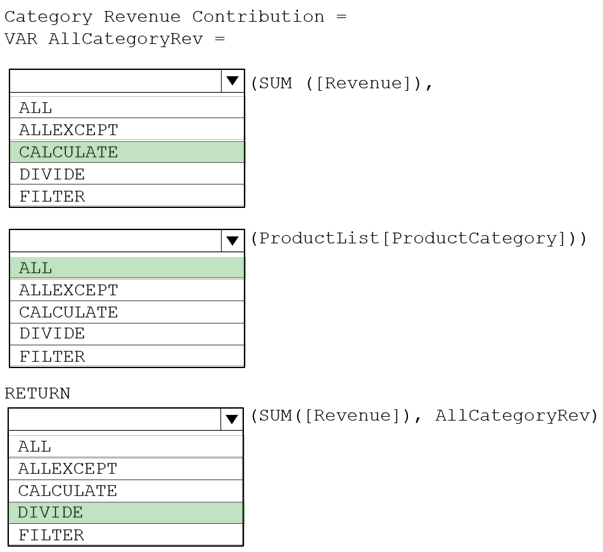
C
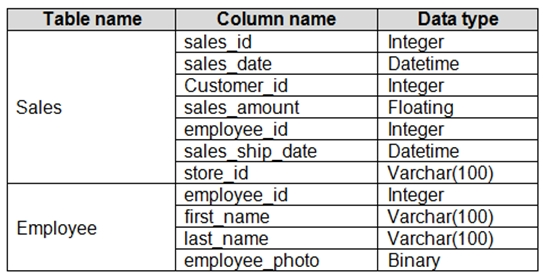
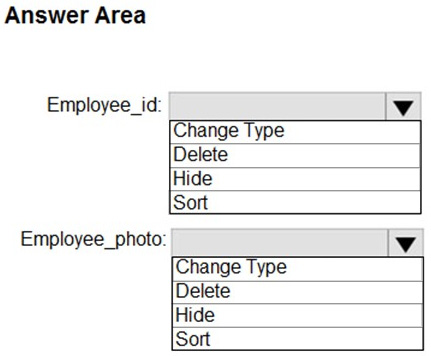
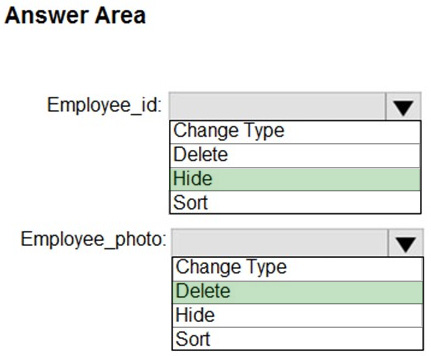
Certify Model1.
D
Apply a sensitivity label to Model1.
Reveal answer detailsClose answer details
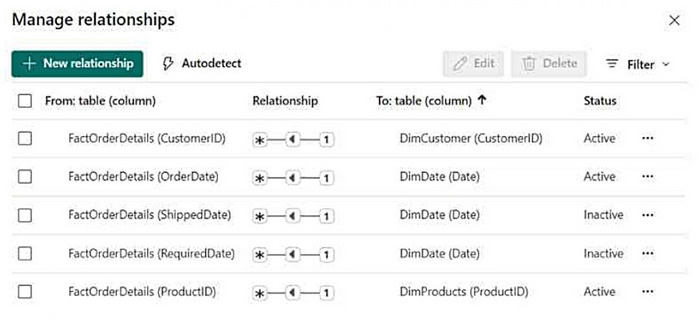
Correct answerC
Question 6
Single choice
Note: This question is part of a series of questions that present the same scenario. Each question in the series contains a unique solution that might meet the stated goals. Some question sets might have more than one correct solution, while others might not have a correct solution.
After you answer a question in this scenario, you will NOT be able to return to it. As a result, these questions will not appear in the review screen.
You have a clustered bar chart that contains a measure named Salary as the value and a field named Employee as the axis. Salary is present in the data as numerical amount representing US dollars.
You need to create a reference line to show which employees are above the median salary.
Solution: You create a percentile line by using the Salary measure and set the percentile to 50%.
Does this meet the goal?
A
Yes
B
No
Reveal answer detailsClose answer details
Correct answerA
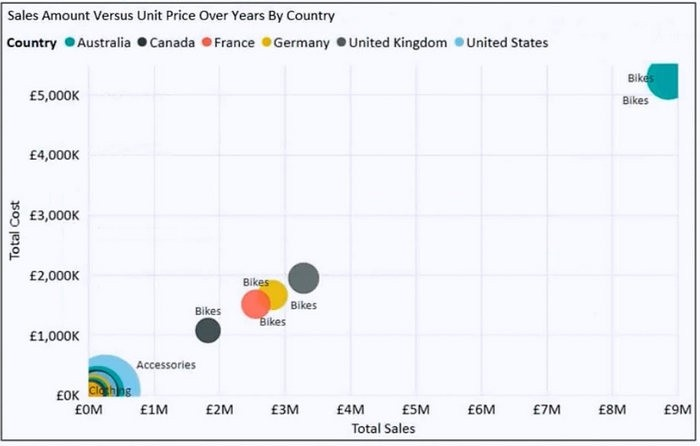
Explanation
The 50th percentile is also known as the median or middle value where 50 percent of observations fall below.
You have a Power BI model that contains two tables named Sales and Date. The Sales table relates to the Date table by using a many-to-one relationship.
The Sales table contains the following columns: 1. Date 2. Product 3. SalesAmount
You need to create a DAX measure for a rolling 31-day sales total that will return the total sales amount for a selected date and the previous 30 days.
You create a Power BI report named RPT1 that contains sales data. The data contains 10 million rows. RPT1 contains 15 different visuals.
Users state that RPT1 is slow to load.
You need to investigate the cause of the issue.
What should you use?
A
Power Query Editor
B
Performance analyzer
C
Query Diagnostics
D
DAX query view
Reveal answer detailsClose answer details
Correct answerB
Question 9
Single choice
Note: This question is part of a series of questions that present the same scenario. Each question in the series contains a unique solution that might meet the stated goals. Some question sets might have more than one correct solution, while others might not have a correct solution.
After you answer a question in this section, you will NOT be able to return to it. As a result, these questions will not appear in the review screen.
You have an on-premises data gateway.
You need to reduce the amount of data sent through the gateway by semantic models that run in Import storage mode.
Solution: You decrease the dashboard cache update frequency.
Does this meet the goal?
A
Yes
B
No
Reveal answer detailsClose answer details
Correct answerB
Question 10
Single choice
You use Power BI Desktop to import two tables named Customer and Contacts. The Customer table contains the following columns:
1. Customer_Name 2. Customer ID 3. Website
The Contacts table contains the following columns: 1. Contact ID 2. Contact Email 3. Contact Name 4. Customer Name
A web-based contact form is used to fill the Contacts table. The data is not sanitized.
You need to create a merge for the Customer and Contacts tables.
What should you do?
A
Disable fuzzy matching.
B
Enable fuzzy matching.
C
Set Join Kind to Left Outer.
D
Set Join Kind to Full Outer
Reveal answer detailsClose answer details
Correct answerB
Question 11
Single choice
You have a Power BI semantic model that contains two tables named DimCustomer and FactOrderDetails.
The primary key of DimCustomer is CustomerID.
FactOrderDetails contains a column named CustomerID that can be used to relate to DimCustomer. Multiple rows in FactOrderDetails possibly have the same CustomerID value.
You need to create a relationship from FactOrderDetails to DimCustomer. The solution must optimize query performance.
What should you create?
A
an active, single-direction, many-to-one relationship
B
an inactive, single-direction, one-to-many relationship
C
an active, single-direction, one-to-many relationship
D
an active, bi-directional, many-to-one relationship
Reveal answer detailsClose answer details
Correct answerA
Question 12
Drag & drop
DRAG DROP
You create a data model in Power BI.
Report developers and users provide feedback that the data model is too complex.
The model contains the following tables.
The model has the following relationships:
1. There is a one-to-one relationship between Sales_Region and Region_Manager. 2. There are more records in Manager than in Region_Manager, but every record in Region_Manager has a corresponding record in Manager. 3. There are more records in Sales_Manager than in Sales_Region, but every record in Sales_Region has a corresponding record in Sales_Manager.
You need to denormalize the model into a single table. Only managers who are associated to a sales region must be included in the reports.
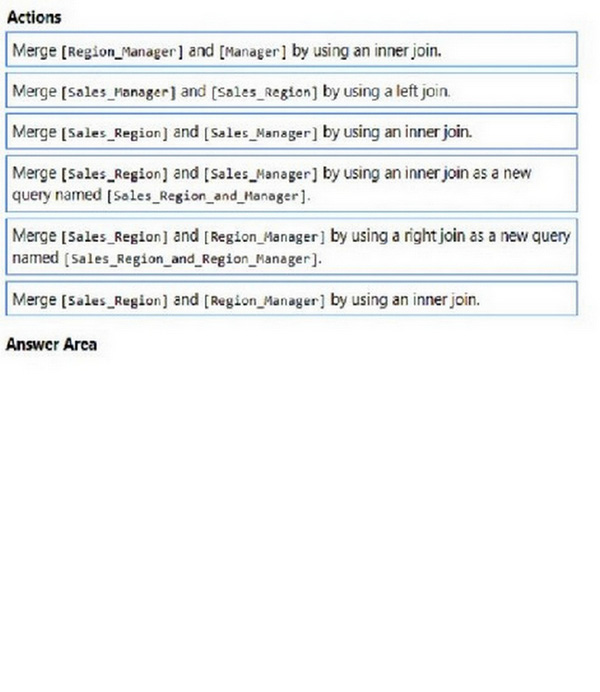
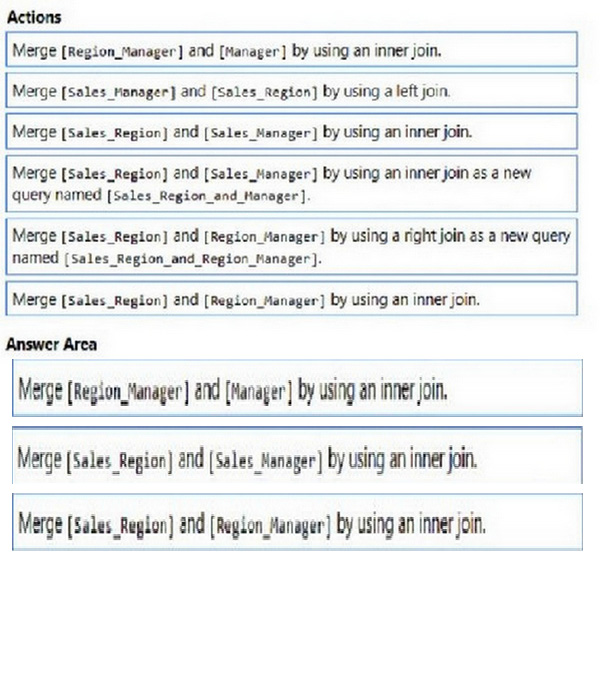
Which three actions should you perform in sequence? To answer, move the appropriate actions from the list of actions to the answer area and arrange them in the correct order.
NOTE: More than one order of answer choices is correct. You will receive credit for any of the correct orders you select.
Reveal answer detailsClose answer details
Explanation
1. Merge [Region_Manager] and [Manager] by using an inner join. 3. Merge [Sales_Region] and [Sales_Manager] by using an inner join. 6. Merge [Sales_Region] and [Region_Manager] by using an inner join.
Question 13
Hotspot
HOTSPOT
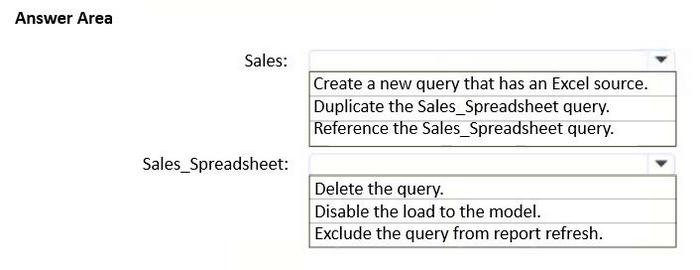
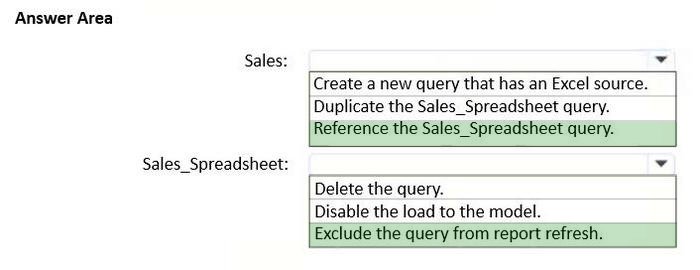
You import a Microsoft Excel spreadsheet into Power Query Editor and name the query Sales_Spreadsheet.
Sales_Spreadsheet contains the following columns: 1. Customer ID 2. Customer Name 3. Date 4. Total Sales Amount
You plan to use the Sales Spreadsheet query to load two tables named Customer and Sales into the associated semantic model. The tables relate to each other on the Customer ID column of each query. The solution must meet the following requirements: 1. The Customer query must contain the Customer ID and Customer Name columns. 2. The Sales query must contain the Customer ID, Date, and Total Sales Amount columns. 3. Power Query logic must be consolidated to avoid the duplication of logic across the queries and ensure
that only one location is used to update the logic.
You need to identify how to create the Sales query, and what to do to the Sales_Spreadsheet query before loading the model. What should you do? To answer, select the appropriate options in the answer area.
NOTE: Each correct selection is worth one point.
Reveal answer detailsClose answer details
Question 14
Single choice
Note: This question is part of a series of questions that present the same scenario. Each question in the series contains a unique solution that might meet the stated goals. Some question sets might have more than one correct solution, while others might not have a correct solution.
After you answer a question in this section, you will NOT be able to return to it. As a result, these questions
will not appear in the review screen.
You have a Microsoft Excel workbook that is saved to Microsoft SharePoint Online. The workbook contains several Power View sheets.
You need to recreate the Power View sheets as reports in the Power Bl service.
Solution: From the Power Bl service, get the data from SharePoint Online, and then click Connect Does this meet the goal?
Note: This question is part of a series of questions that present the same scenario. Each question in the series contains a unique solution that might meet the stated goals. Some question sets might have more than one correct solution, while others might not have a correct solution.
After you answer a question in this section, you will NOT be able to return to it. As a result, these questions will not appear in the review screen.
You have an on-premises data gateway.
You need to reduce the amount of data sent through the gateway by semantic models that run in import storage mode.
Solution: You increase Automatic page refresh intervals.
Does this meet the goal?
A
Yes
B
No
Reveal answer detailsClose answer details
Correct answerB
Question 16
Hotspot
HOTSPOT
You have a Power BI semantic model.
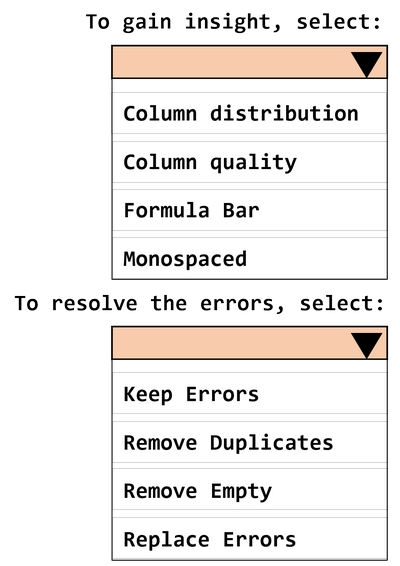
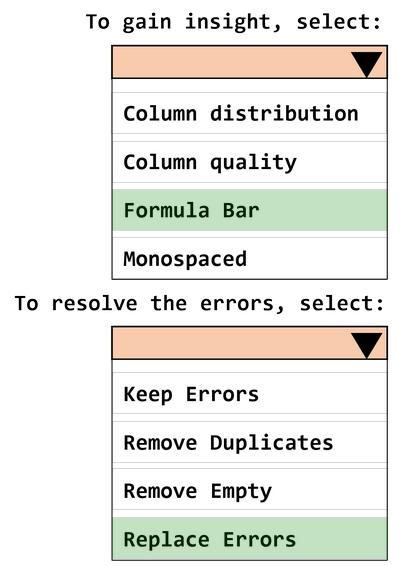
You discover that he semantic model contains values that display as errors.
You need to use data profiling feature in Power Query to preview the date and identify the issues.
What should you select to gain into the number of errors in the model, and what should you select to resolve the errors? To answer, select the appropriate options in the answer area.
NOTE: Each correct answer is worth one point.
Reveal answer detailsClose answer details
Question 17
Multiple choice
You have a Power BI report named Report1. You plan to share Report1 with multiple users.
You need to add the users to a group.
Which two types of groups can you use? Each correct answer presents a complete solution.
NOTE: Each correct selection is worth one point.
A
security group
B
distribution group
C
Microsoft Teams team
D
Microsoft 365 group
Reveal answer detailsClose answer details
Correct answersA, D
Question 18
Single choice
A business intelligence (Bl) developer creates a dataflow in Power Bl that uses DirectQuery to access tables from an on premises Microsoft SQL server. The Enhanced Dataflows Compute Engine is turned on for the dataflow.
You need to use the dataflow in a report. The solution must meet the following requirements:
1. Minimize online processing operations. 2. Minimize calculation times and render times for visuals. 3. include data from the current year, up to and including the previous day.
What should you do?
A
Create a dataflows connection that has Import mode selected and schedule a dairy refresh.
B
Create a dataflows connection that has DirectQuery mode selected.
C
Create a dataflows connection that has DirectQuery mode selected and configure a gateway connection for the dataset
D
Create a dataflows connection that has Import mode selected and create a Microsoft Power Automate solution to refresh the data hourly.
Reveal answer detailsClose answer details
Correct answerA
Question 19
Hotspot
HOTSPOT
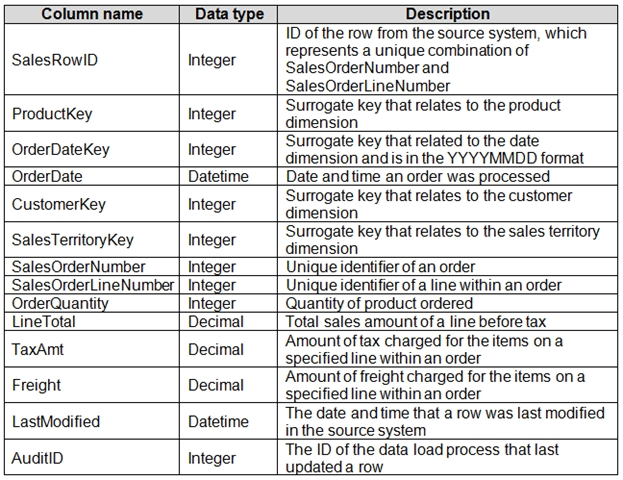
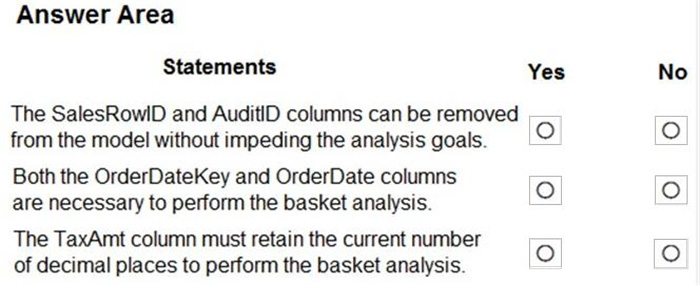
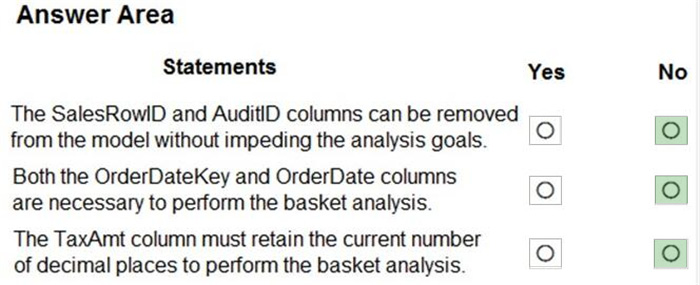
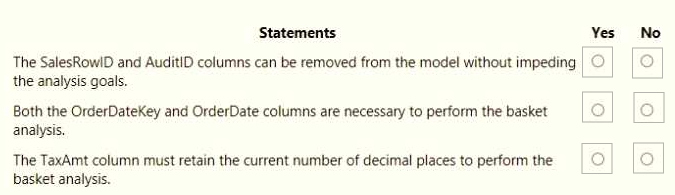
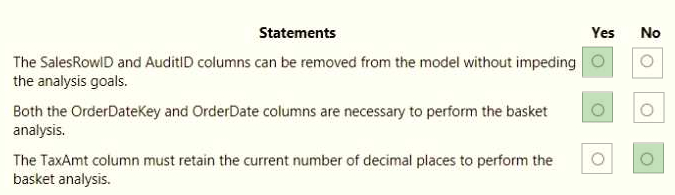
You are creating a Microsoft Power BI imported data model to perform basket analysis. The goal of the analysis is to identify which products are usually bought together in the same transaction across and within sales territories.
You import a fact table named Sales as shown in the exhibit. (Click the Exhibit tab.)
The related dimension tables are imported into the model.
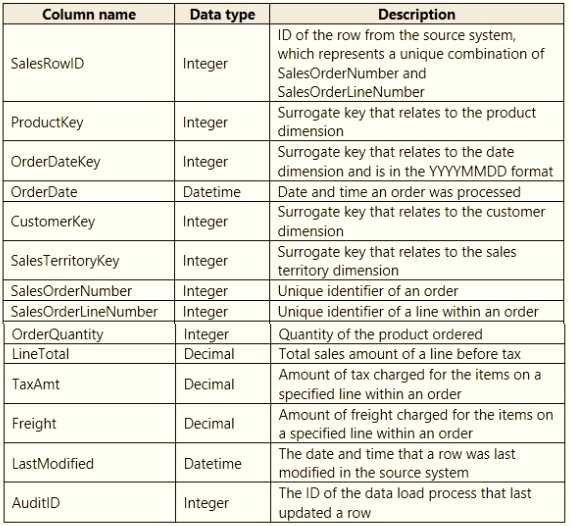
Sales contains the data shown in the following table.
You are evaluating how to optimize the model.
For each of the following statements, select Yes if the statement is true. Otherwise, select No.
You have a Power Bl workspace named Workspace1 that contains a dataset named DS1 and a report named RPT1.
A user wants to create a report by using the data In DS1 and publish the report to another workspace.
You need to provide the user with the appropriate access. The solution must minimize the number of access permissions granted to the user.
What should you do?
A
Share RPT1 with the user.
B
Add the user as a Viewer of Workspace1.
C
Add the user as a member of Workspace1.
D
Grant the Build permission for DS1 to the user.
Reveal answer detailsClose answer details
Correct answerD
Explanation
Microsoft says: To copy a report to another workspace, and to create a report in another workspace based on a dataset in the current workspace, you need Build permission for the dataset. For datasets in the original workspace, if you have at least the Contributor role, you automatically have Build permission through your workspace role. https://learn.microsoft.com/en-us/power-bi/collaborate-share/service-roles-new-workspaces
Question 21
Single choice
You have a Power B1 report that contains one visual You need to provide users with the ability to change the visual type without affecting the view for other users.
What should you do?
A
From Tabular Editor, create a new perspective.
B
From Report settings, select Personalize visuals
C
From the Bookmarks pane, select Focus mode and then select Add
D
From Visual options in Report settings, select Use the modem visual header with updated styling options
Reveal answer detailsClose answer details
Correct answerB
Question 22
Single choice
Note: This question is part of a series of questions that present the same scenario. Each question in the series contains a unique solution that might meet the stated goals. Some question sets might have more than one correct solution, while others might not have a correct solution.
After you answer a question in this section, you will NOT be able to return to it. As a result, these questions will not appear in the review screen.
You create a parameter named DataSourceExcel that holds the file name and location of a Microsoft Excel data source. You need to update the query to reference the parameter instead of multiple hard-coded copies of the location within each query definition.
Solution: You modify the source step of the queries to use DataSourceExcel as the file path.
Does this meet the goal?
A
Yes
B
No
Reveal answer detailsClose answer details
Correct answerA
Explanation
Parameterising a Data Source could be used in many different use cases. From connecting to different data sources defined in Query Parameters to load different combinations of columns.
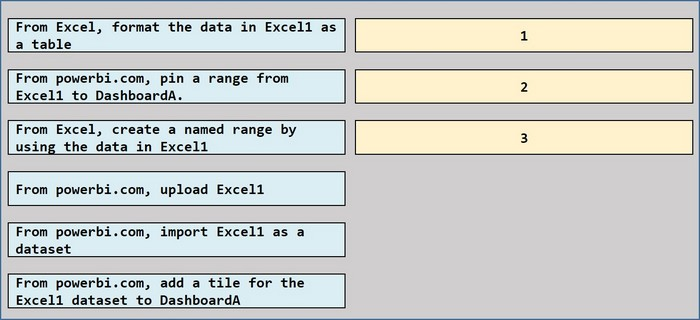
You have a Microsoft Exert spreadsheet named Excel1 that contains survey results.
You have a Power Bl dashboard named DashboardA that has Q&A enabled.
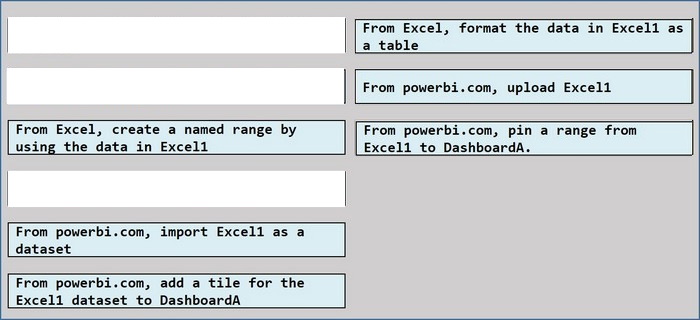
You need to ensure that users who can access DashboardA can ask Questions based on the contents of Excel 1 and pm visuals based on their queries to DashboardA. The solution must minimize development time.
Which three actions should you perform in sequence? To answer, move the appropriate actions from the list of actions to the answer area and arrange them in the correct order.
Reveal answer detailsClose answer details
Question 24
Hotspot
HOTSPOT
You have an API that returns more than 100 columns. The following is a sample of column names.
You have a Power BI tenant that allows users to export data.
You need to ensure that consumers of ReportA cannot export any data from visuals.
Which two actions should you perform? Each correct answer presents a complete solution.
NOTE: Each correct selection is worth one point.
A
From Power BI Desktop, modify the Report settings.
B
From Power BI Desktop, modify the Data Load settings.
C
From the Power BI service, modify the dataset permissions.
D
From the Power BI service, modify the Report settings.
Reveal answer detailsClose answer details
Correct answersA, D
Question 26
Single choice
You need to create a visual that compares profit across 10 product categories for a selected quarter.
What is the best visual to use to achieve the goal? More than one answer choice may achieve the goal Select the BEST answer.
A
an area chart
B
a clustered bar chart
C
a line chart
D
a funnel chart
Reveal answer detailsClose answer details
Correct answerB
Case study
Case Study 3
Overview. General Overview
Northwind Traders is a specialty food import company.
The company recently implemented Power BI to better understand its top customers, products, and suppliers.
Overview. Business Issues
The sales department relies on the IT department to generate reports in Microsoft SQL Server Reporting Services (SSRS). The IT department takes too long to generate the reports and often misunderstands the report requirements.
Existing Environment. Data Sources
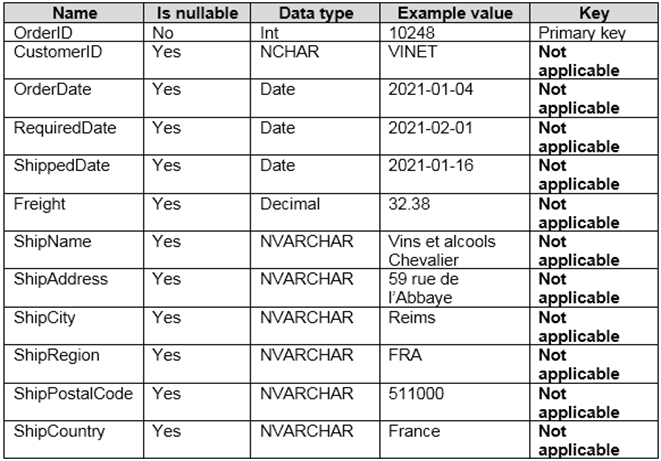
Northwind Traders uses the data sources shown in the following table.
Source2 is exported daily from a third-party system and stored in Microsoft SharePoint Online.
Existing Environment. Customer Worksheet
Source2 contains a single worksheet named Customer Details. The first 11 rows of the worksheet are shown in the following table.
All the fields in Source2 are mandatory.
The Address column in Customer Details is the billing address, which can differ from the shipping address.
The Order Details table contains the following columns.
The address in the Orders table is the shipping address, which can differ from the billing address.
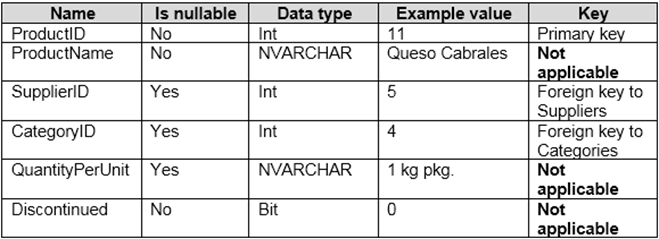
The Products table contains the following columns.
The Categories table contains the following columns.
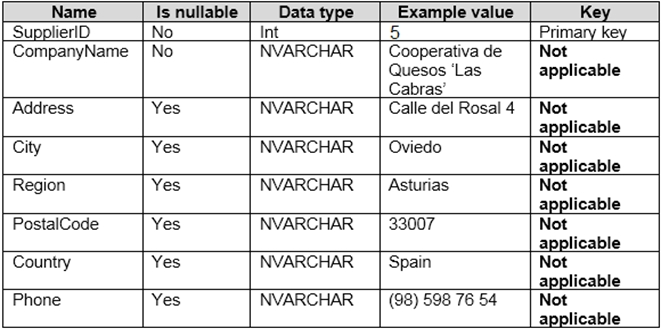
The Suppliers table contains the following columns.
The Sales Employees table contains the following columns.
Each employee in the Sales Employees table is assigned to one sales region. Multiple employees can be assigned to each region.
Requirements. Report Requirements
Northwind Traders requires the following reports:
1. Top Products 2. Top Customers 3. On-Time Shipping
The Top Customers report will show the top 20 customers based on the highest sales amounts in a selected order month or quarter, product category, and sales region.
The Top Products report will show the top 20 products based on the highest sales amounts sold in a selected order month or quarter, sales region, and product category. The report must also show which suppliers provide the top products.
The On-Time Shipping report will show the following metrics for a selected shipping month or quarter:
1. The percentage of orders that were shipped late by country and shipping region 2. Customers that had multiple late shipments during the last quarter
Northwind Traders defines late orders as those shipped after the required shipping date.
The warehouse shipping department must be notified if the percentage of late orders within the current month exceeds 5%.
The reports must show historical data for the current calendar year and the last three calendar years.
Requirements. Technical Requirements
Northwind Traders identifies the following technical requirements:
1. A single dataset must support all three reports. 2. The reports must be stored in a single Power BI workspace. 3. Report data must be current as of 7 AM Pacific Time each day. 4. The reports must provide fast response times when users interact with a visualization. 5. The data model must minimize the size of the dataset as much as possible, while meeting the report requirements and the technical requirements.
Requirements. Security Requirements
Access to the reports must be granted to Azure Active Directory (Azure AD) security groups only. An Azure AD security group exists for each department.
The sales department must be able to perform the following tasks in Power BI:
1. Create, edit, and delete content in the reports. 2. Manage permissions for workspaces, datasets, and report. 3. Publish, unpublish, update, and change the permissions for an app. 4. Assign Azure AD groups role-based access to the reports workspace.
Users in the sales department must be able to access only the data of the sales region to which they are assigned in the Sales Employees table.
Power BI has the following row-level security (RLS) Table filter DAX expression for the Sales Employees table.
[EmailAddress] = USERNAME()
RLS will be applied only to the sales department users. Users in all other departments must be able to view all the data.
Question 27
Testlet 3Hotspot
HOTSPOT
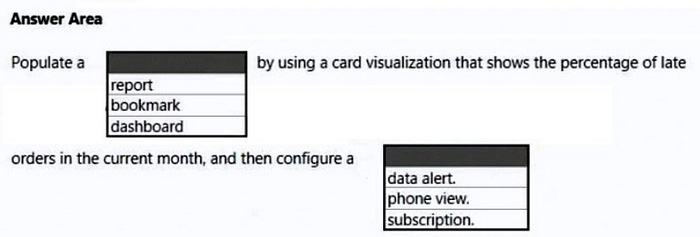
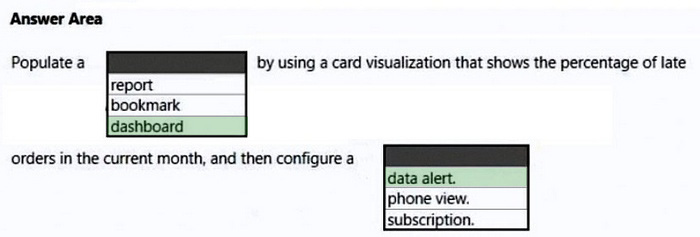
You need to create a solution to meet the notification requirements of the warehouse shipping department.
What should you do? To answer, select the appropriate options in the answer area.
NOTE: Each correct select is worth one point:
Reveal answer detailsClose answer details
Explanation
Box 1: dashboard The warehouse shipping department must be notified if the percentage of late orders within the current month exceeds 5%.
You can set alerts to notify you when data in your dashboards changes beyond limits you set.
Box 2: data alert References: https://docs.microsoft.com/en-us/power-bi/create-reports/service-set-data-alerts
Question 28
Hotspot
HOTSPOT
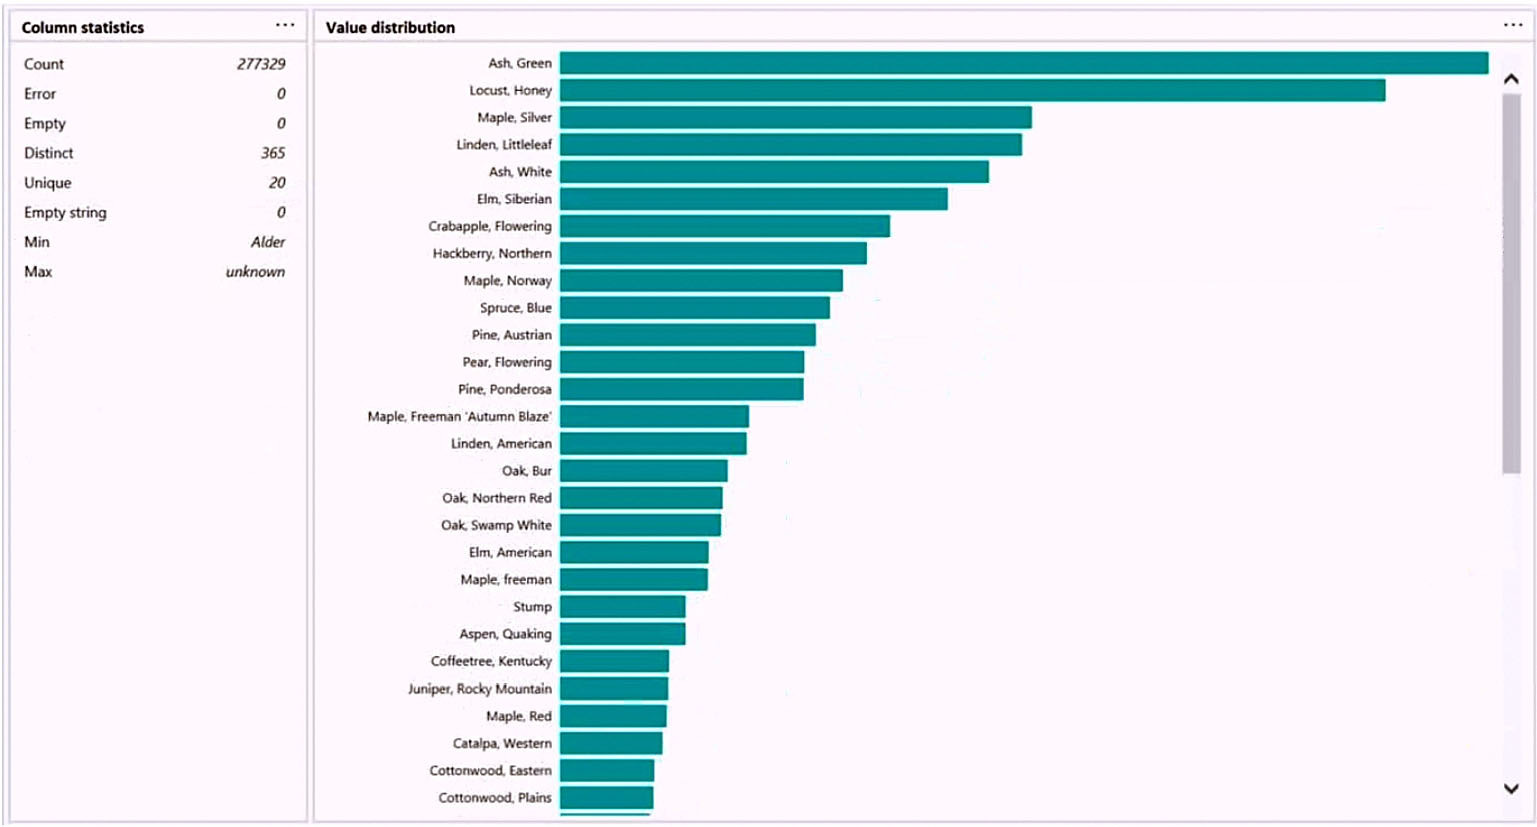
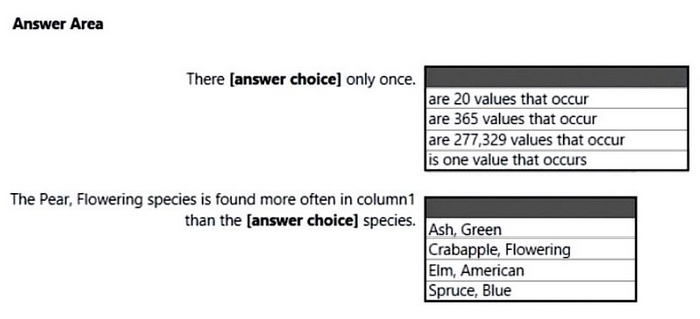
You are profiling data by using Power Query Editor.
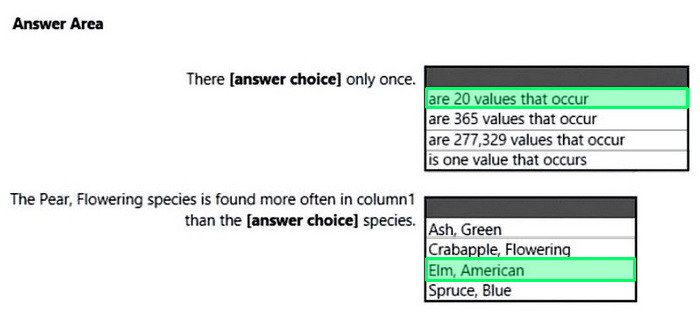
You have a table that contains a column named column1. Column statistics and Value distribution for column1 are shown in the following exhibit.
Use the drop-down menus to select the answer choice that completes each statement based on the information presented in the graphic. NOTE: Each correct selection is worth one point.
Reveal answer detailsClose answer details
Explanation
Box 1: are 20 values that occur - There are 20 unique values.
Box 2: Elm, American - Elm, American is below Peer, flowering species in the graphic.
Question 29
Drag & drop
DRAG DROP
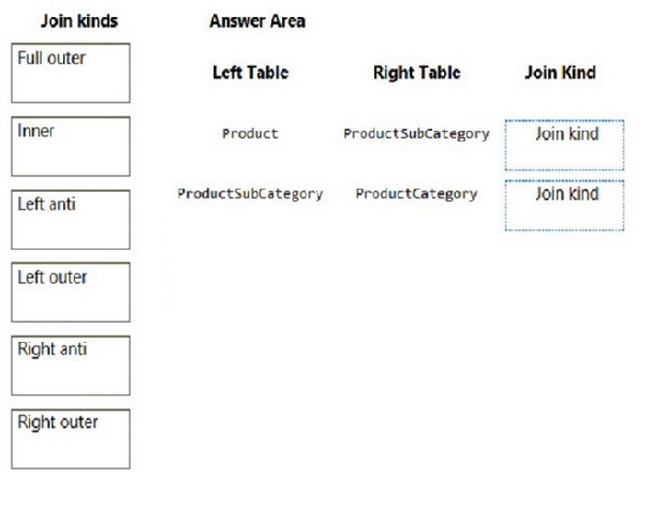
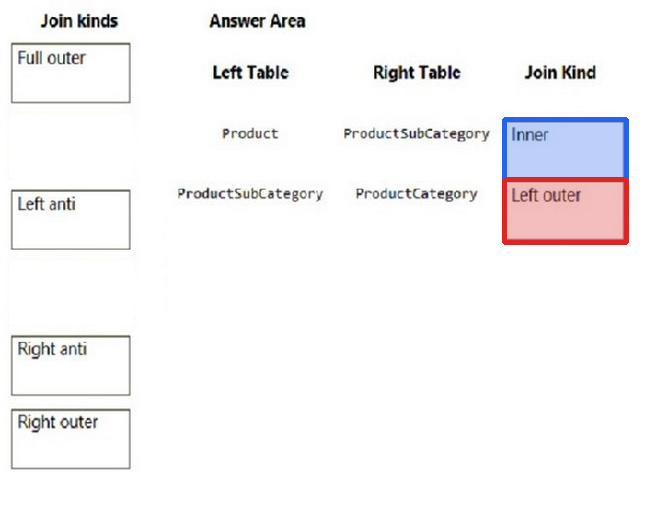
In Power Query Editor, you have three queries named ProductCategory, ProductSubCategory, and Product.
Every Product has a ProductSubCategory.
Not every ProductsubCategory has a parent ProductCategory.
You need to merge the three queries into a single query. The solution must ensure the best performance in Power Query.
How should you merge the tables? To answer, drag the appropriate merge types to the correct queries. Each merge type may be used once, more than once, or not at all. You may need to drag the split bar between panes or scroll to view content.
NOTE: Each correct selection is worth one point.
Reveal answer detailsClose answer details
Question 30
Hotspot
HOTSPOT
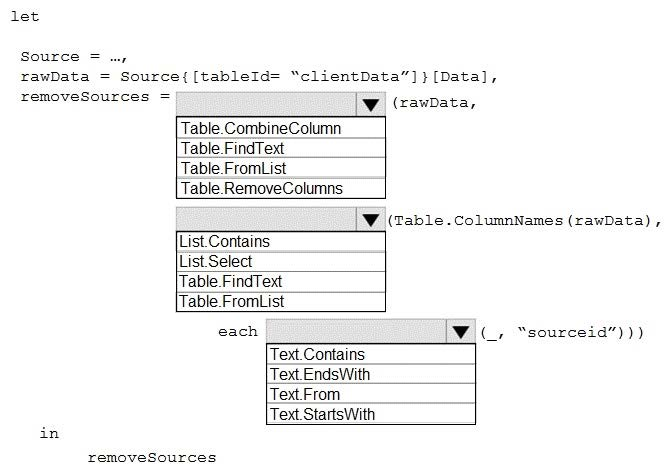
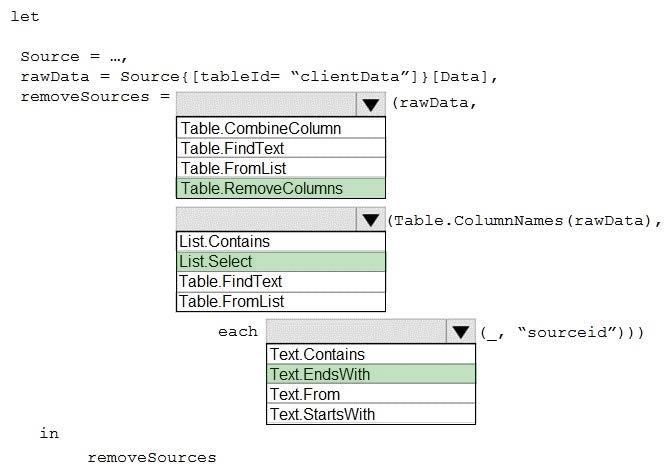
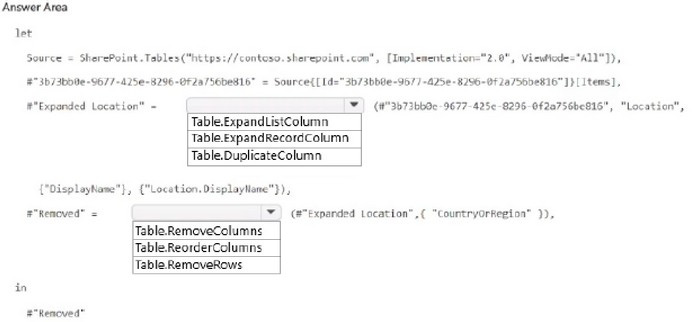
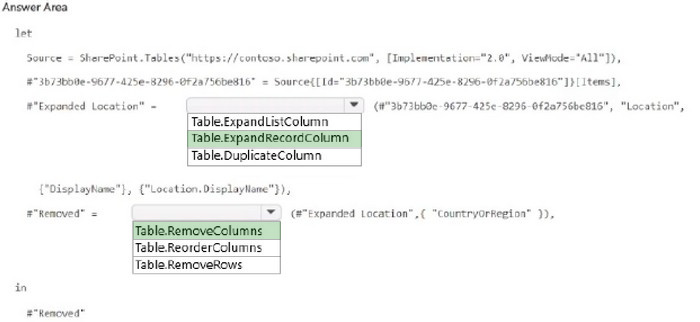
You use Power Query Editor to pull data from a Microsoft SharePoint Online list.
You plan to use Advanced Editor to build a Power Query M formula language query.
You need to create a query that loads the data, expands a column named location, and hides a column named CountryOrRegion from the dataset.
How should you complete the query? To answer, select the appropriate options in the answer area.
NOTE: Each correct answer is worth one point.
Reveal answer detailsClose answer details
Question 31
Single choice
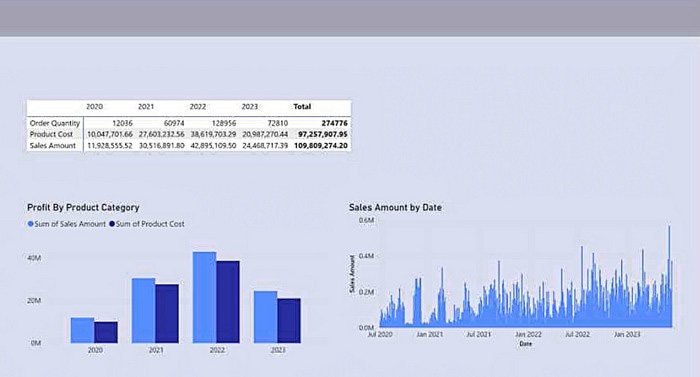
You have a Power BI report. The report contains a single report page that uses the default theme.
You need to configure the report page to match the formatting shown in the following exhibit.
What should you change on the report page?
A
the wallpaper color only
B
the canvas background color only
C
the wallpaper color and the canvas background color only
D
the canvas background image only
Reveal answer detailsClose answer details
Correct answerA
Question 32
Single choice
You have a Power BI model that contains a table named Expenses. The table contains the following columns: 1. Date 2. Amount 3. Category 4. Expense ID 5. Employee ID
Expenses are recorded by employees, and each expense has a unique expense ID.
You need to create a DAX measure that will calculate the total amount of expenses.
Which DAX expression should you use?
A
Sum('Expenses'[Amount])
B
Max('Expenses'[Amount])
C
Sum('Expenses'[Expense ID])
D
Count('Expenses'[Amount])
Reveal answer detailsClose answer details
Correct answerA
Question 33
Hotspot
HOTSPOT
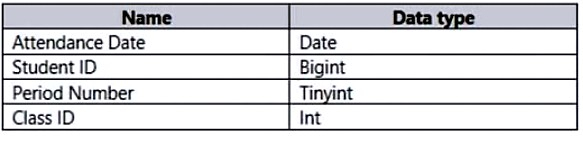
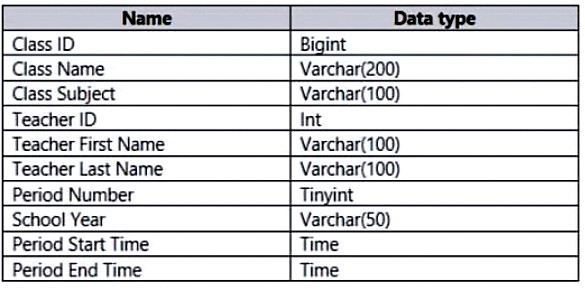
You plan to create a Power Bl dataset to analyze attendance at a school. Data will come from two separate views named View1 and View? in an Azure SQL database. View1 contains the columns shown in the following table.
View2 contains the columns shown in the following table.
The views can be related based on the Class ID column.
Class ID is the unique identifier for the specified class, period, teacher, and school year. For example, the
same class can be taught by the same teacher during two different periods, but the class will have a different class ID.
You need to design a star schema data model by using the data in both views. The solution must facilitate the following analysis:
1. The count of classes that occur by period 2. The count of students in attendance by period by day 3. The average number of students attending a class each month
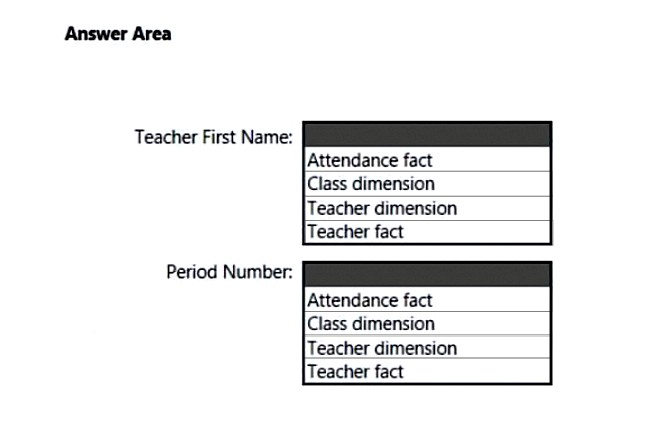
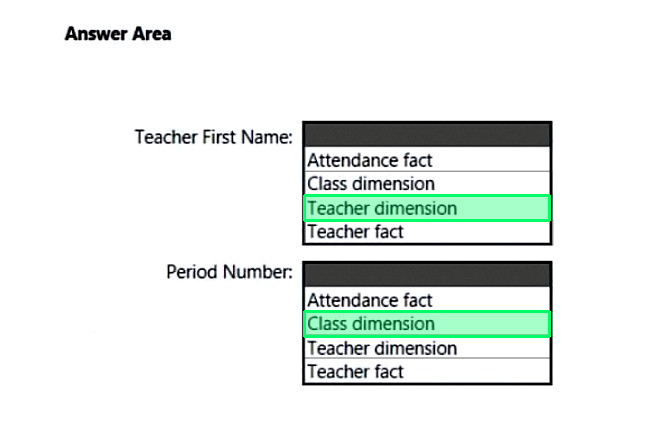
In which table should you include the Teacher First Name and Period Number fields? To answer, select the appropriate options in the answer area. NOTE: Each correct selection is worth one point.
Reveal answer detailsClose answer details
Question 34
Hotspot
HOTSPOT
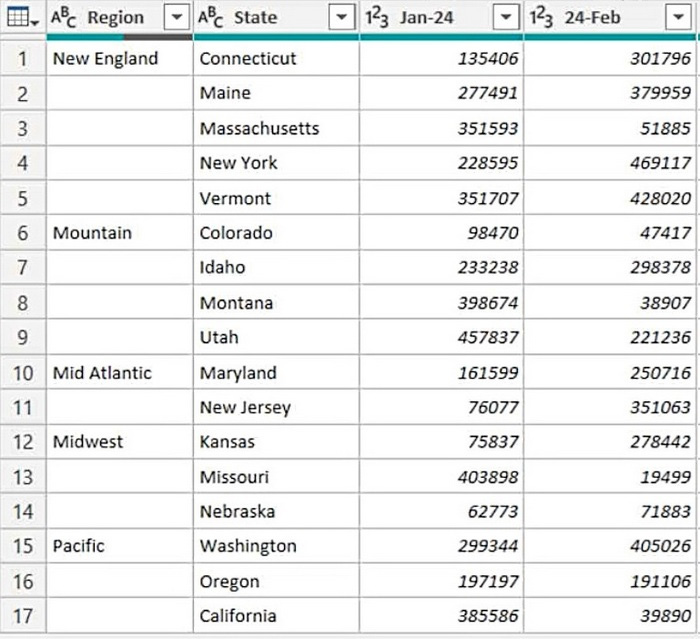
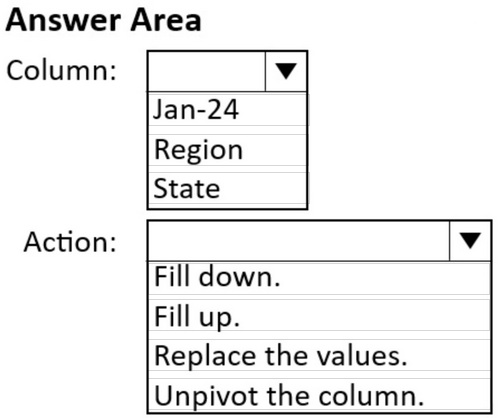
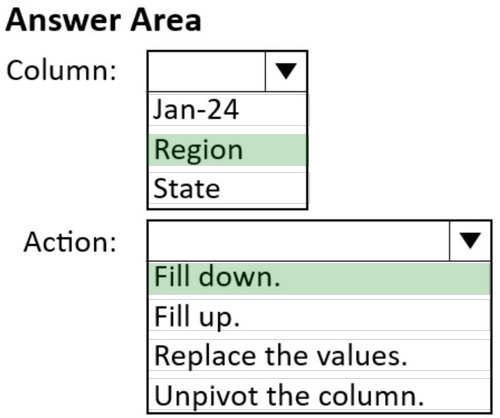
You use Power Query Editor to review the query shown in the following exhibit.
Each Region value appears only on the row where it first occurred. Each subsequent occurrence of the Region value is blank.
You need to ensure that every row contains the correct non-blank value. The solution must minimize development effort.
Which column should you select, and which action should you perform on the column? To answer, select the appropriate options in the answer area.
NOTE: Each correct selection is worth one point.
Reveal answer detailsClose answer details
Question 35
Hotspot
HOTSPOT
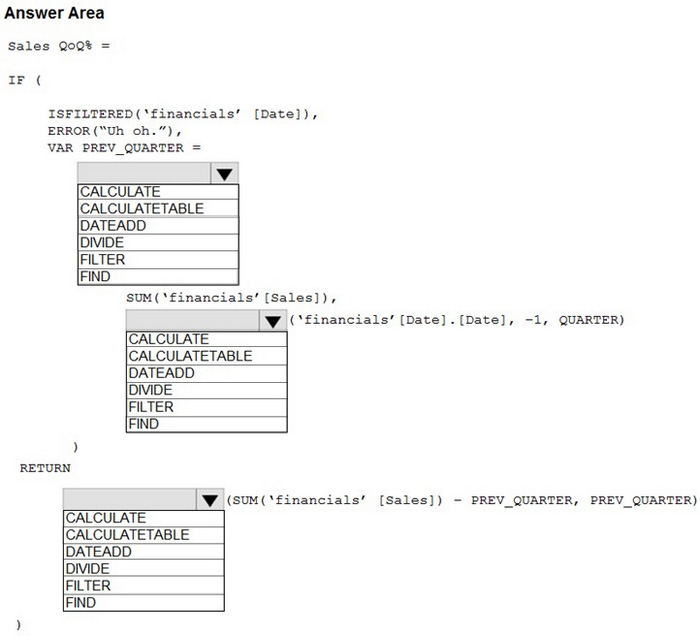
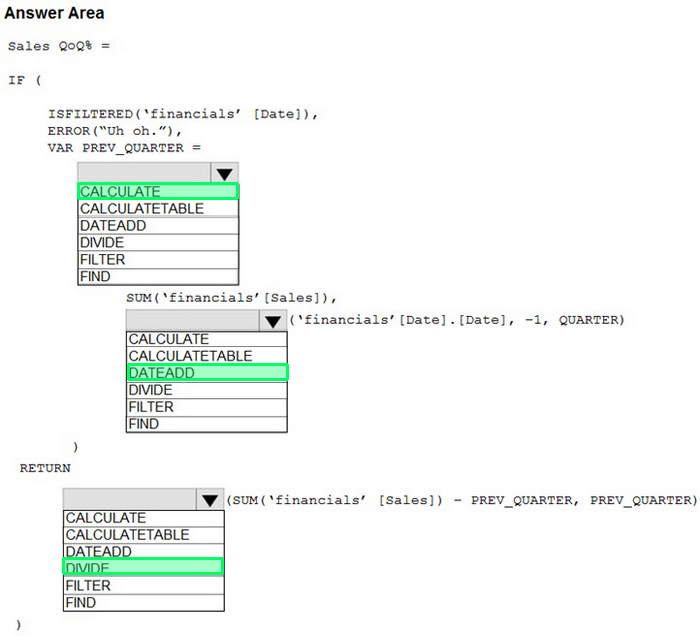
You are building a financial report by using Power BI.
You have a table named financials that contains a column named Date and a column named Sales.
You need to create a measure that calculates the relative change in sales as compared to the previous quarter.
How should you complete the measure? To answer, select the appropriate options in the answer area.
NOTE: Each correct selection is worth one point.
Reveal answer detailsClose answer details
Explanation
Box 1: CALCULATE
Box 2: DATEADD
Box 3: DIVIDE
Example: NET_SALES QoQ% = IF( ISFILTERED('Calendar'[Date]), ERROR("Time intelligence quick measures can only be grouped or filtered by the Power BI-provided date hierarchy or primary date column."), VAR__PREV_QUARTER = CALCULATE( SUM('research ra_qtr_template'[NET_SALES]), DATEADD('Calendar'[Date].[Date], -1, QUARTER) )
You have a Power BI semantic model that connects to a streaming data source. The data source is updated frequently.
You need to create a Power BI report that meets the following requirements: 1. Supports real-time analytics 2. Minimizes performance impact on the data source 3. Displays the most recent data without performing a data refresh
Which connectivity mode should you use for the dataset?
A
DirectQuery mode
B
import mode
C
LiveConnect mode
D
push mode
Reveal answer detailsClose answer details
Correct answerD
Question 37
Hotspot
HOTSPOT
You have a semantic model that contains a table named Sales.
The table contains the following columns:
1. Order ID 2. Product ID 3. Sales Dote 4. Sales Amount
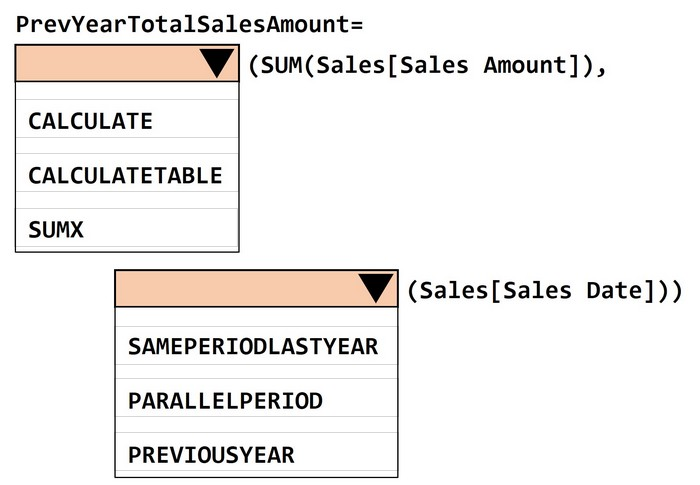
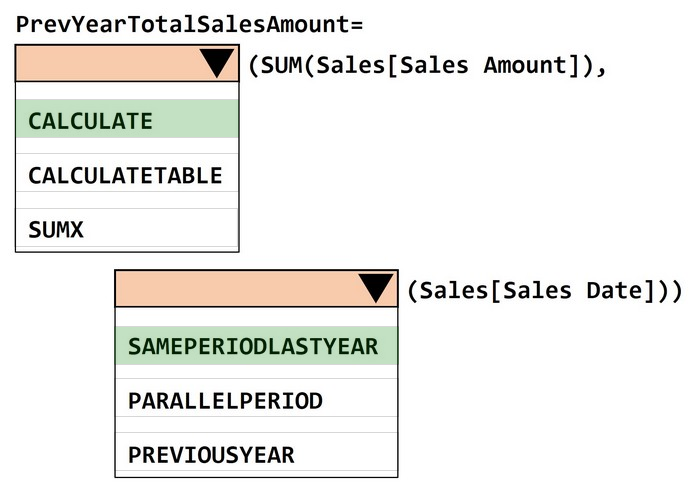
You need to create a DAX measure that will return the total sales amount for the same dates from the previous year. How should you complete the measure? To answer, select the appropriate options m the answer area.
NOTE: Each correct selection is worth one point.
Reveal answer detailsClose answer details
Question 38
Single choice
You plan to use Power Bl Desktop to create a bog tracking dashboard that will pull data from Analytics in Azure DevOps.
From Power Bl Desktop, you need to configure a data connector to authenticate to Azure DevOps. The solution must meet the following requirements:
1. Use Analytics views. 2. Filter data from the cloud.
Which connector should you use?
A
OData queries
B
Azure DevOps (Boards only)
C
Azure DevOps Server (Boards only)
D
OData feed
Reveal answer detailsClose answer details
Correct answerB
Question 39
Multiple choice
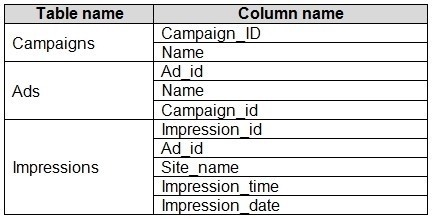
You have the tables shown in the following table.
The Impressions table contains approximately 30 million records per month.
You need to create an ad analytics system to meet the following requirements:
1. Present ad impression counts for the day, campaign, and Site_name. 2. The analytics for the last year are required. 3. Minimize the data model size.
Which two actions should you perform? Each correct answer presents part of the solution.
NOTE: Each correct selection is worth one point.
A
Group the impressions by Ad_id, Site_name, and Impression_date.Aggregate by using the CountRows function.
B
Create one-to-many relationships between the tables.
C
Create a calculated measure that aggregates by using the COUNTROWS function.
D
Create a calculated table that contains Ad_id, Site_name, and Impression_date.
Reveal answer detailsClose answer details
Correct answersA, B
Explanation
Grouping in power query reduces the number of rows in the impression table that is gonna be loaded in the model. Creating relationships doesn't increase the size of the model.
Question 40
Single choice
You have a Power Bl report hosted on powerbi.com that displays expenses by department for department managers.
The report contains a line chart that shows expenses by month.
You need to enable users to choose between viewing the report as a line chart or a column chart. The solution must minimize development and maintenance effort.
What should you do?
A
Add a column chart, a bookmark, and a button for users to choose a visual.
B
Create a mobile report that contains a column chart.
C
Create a separate report page for users to view the column chart.
D
Enable report readers to personalize visuals.
Reveal answer detailsClose answer details
Correct answerD
Case study
Case Study 2
Overview
Contoso, Ltd. is a manufacturing company that produces outdoor equipment. Contoso has quarterly board meetings for which financial analysts manually prepare Microsoft Excel reports, including profit and loss statements for each of the company's four business units, a company balance sheet, and net income projections for the next quarter.
Existing Environment
Data and Sources
Data for the reports comes from three sources. Detailed revenue, cost, and expense data comes from an Azure SQL database. Summary balance sheet data comes from Microsoft Dynamics 365 Business Central. The balance sheet data is not related to the profit and loss results, other than they both relate dates.
Monthly revenue and expense projections for the next quarter come from a Microsoft SharePoint Online list. Quarterly projections relate to the profit and loss results by using the following shared dimensions: date, business unit, department, and product category.
Net Income Projection Data
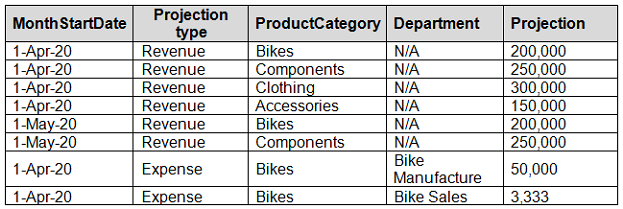
Net income projection data is stored in a SharePoint Online list named Projections in the format shown in the following table.
Revenue projections are set at the monthly level and summed to show projections for the quarter.
Balance Sheet Data
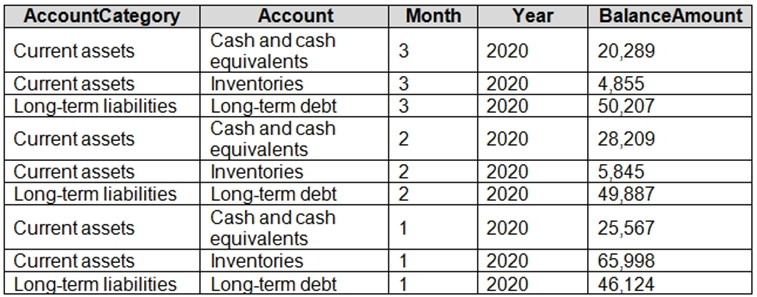
The balance sheet data is imported with final balances for each account per month in the format shown in the following table.
There is always a row for each account for each month in the balance sheet data.
Dynamics 365 Business Central Data
Business Central contains a product catalog that shows how products roll up to product categories, which roll up to business units.
Revenue data is provided at the date and product level. Expense data is provided at the date and department level.
Business Issues
Historically, it has taken two analysts a week to prepare the reports for the quarterly board meetings. Also, there is usually at least one issue each quarter where a value in a report is wrong because of a bad cell reference in an Excel formula. On occasion, there are conflicting results in the reports because the products and departments that roll up to each business unit are not defined consistently.
Requirements
Planned Changes
Contoso plans to automate and standardize the quarterly reporting process by using Microsoft Power BI. The company wants to how long it takes to populate reports to less than two days. The company wants to create common logic for business units, products, and departments to be used across all reports, including, but not limited, to the quarterly reporting for the board.
Technical Requirements
Contoso wants the reports and datasets refreshed with minimal manual effort.
The company wants to provide a single package of reports to the board that contains custom navigation and links to supplementary information.
Maintenance, including manually updating data and access, must be minimized as much as possible.
Security Requirements
The reports must be made available to the board from powerbi.com. An Azure Active Directory group will be used to share information with the board.
The analysts responsible for each business unit must see all the data the board sees, except the profit and loss data, which must be restricted to only their business unit's data. The analysts must be able to build new reports from the dataset that contains the profit and loss data, but any reports that the analysts build must not be included in the quarterly reports for the board. The analysts must not be able to share the quarterly reports with anyone.
Report Requirements
You plan to relate the balance sheet to a standard date table in Power BI in a many-to-one relationship based on the last day of the month. At least one of the balance sheet reports in the quarterly reporting package must show the ending balances for the quarter, as well as for the previous quarter.
Projections must contain a column named RevenueProjection that contains the revenue projection amounts. A relationship must be created from Projections to a table named Date that contains the columns shown in the following table.
The definitions and attributes of products, departments, and business units must be consistent across all reports.
The board must be able to get the following information from the quarterly reports:
1. Revenue trends over time 2. Ending balances for each account 3. A comparison of expenses versus projections by quarter 4. Changes in long-term liabilities from the previous quarter 5. A comparison of quarterly revenue versus the same quarter during the prior year
Question 41
Testlet 2Single choice
What is the minimum number of datasets and storage modes required to support the reports? (What is the minimum number of Power BI datasets needed to support the reports? )
A
two imported datasets
B
a single DirectQuery dataset
C
two DirectQuery datasets
D
a single imported dataset
Reveal answer detailsClose answer details
Correct answerA
Explanation
Analysts must be able to create new reports from the dataset that contains the profit and loss data, but the reports built by the analysts must NOT be included in the quarterly reports for the board. Analysts must NOT be able to make new reports by using the balance sheet data. Two datasets are required. Need DAX for: A comparison of quarterly revenue versus the same quarter from the previous year. Also see other questions in this Case study which uses DAX expressions. Incorrect: Not DirectQuery: DirectQuery Limited Transformations. You are not able to use all of the normal Power Query transformation features. Particular DAX functions are not available in this method as well. So if your data is poorly structured or needing lots of transformation, sometimes Direct Query is not a viable option. References:
Question 42
Single choice
You use an R visual to produce a map of 500,000 customers. You include the values of CustomerID, Latitude, and Longitude in the fields sent to the visual. Each customer ID is unique.
In powerbi.com, when users load the visual, they only see some of the customers.
What is the cause of the issue?
A
The visual was built by using a different version of R.
B
The data comes from a Microsoft SQL Server source.
C
The data is deduplicated.
D
Too many records were sent to the visual.
Reveal answer detailsClose answer details
Correct answerD
Explanation
R visuals in the Power BI service have a few limitations including: Data size limitations ?data used by the R visual for plotting is limited to 150,000 rows. If more than 150,000 rows are selected, only the top 150,000 rows are used and a message is displayed on the image. Additionally, the input data has a limit of 250 MB.
You plan to generate a line chart to visualize and compare the last six months of sales data for two departments.
You need to increase the accessibility of the visual.
What should you do?
A
Configure a unique marker for each series.
B
Configure a distinct color for each series.
C
Replace long text with abbreviations and acronyms.
D
Move important information to a tooltip.
Reveal answer detailsClose answer details
Correct answerA
Case study
Case Study 3
Overview. General Overview
Northwind Traders is a specialty food import company.
The company recently implemented Power BI to better understand its top customers, products, and suppliers.
Overview. Business Issues
The sales department relies on the IT department to generate reports in Microsoft SQL Server Reporting Services (SSRS). The IT department takes too long to generate the reports and often misunderstands the report requirements.
Existing Environment. Data Sources
Northwind Traders uses the data sources shown in the following table.
Source2 is exported daily from a third-party system and stored in Microsoft SharePoint Online.
Existing Environment. Customer Worksheet
Source2 contains a single worksheet named Customer Details. The first 11 rows of the worksheet are shown in the following table.
All the fields in Source2 are mandatory.
The Address column in Customer Details is the billing address, which can differ from the shipping address.
The Order Details table contains the following columns.
The address in the Orders table is the shipping address, which can differ from the billing address.
The Products table contains the following columns.
The Categories table contains the following columns.
The Suppliers table contains the following columns.
The Sales Employees table contains the following columns.
Each employee in the Sales Employees table is assigned to one sales region. Multiple employees can be assigned to each region.
Requirements. Report Requirements
Northwind Traders requires the following reports:
1. Top Products 2. Top Customers 3. On-Time Shipping
The Top Customers report will show the top 20 customers based on the highest sales amounts in a selected order month or quarter, product category, and sales region.
The Top Products report will show the top 20 products based on the highest sales amounts sold in a selected order month or quarter, sales region, and product category. The report must also show which suppliers provide the top products.
The On-Time Shipping report will show the following metrics for a selected shipping month or quarter:
1. The percentage of orders that were shipped late by country and shipping region 2. Customers that had multiple late shipments during the last quarter
Northwind Traders defines late orders as those shipped after the required shipping date.
The warehouse shipping department must be notified if the percentage of late orders within the current month exceeds 5%.
The reports must show historical data for the current calendar year and the last three calendar years.
Requirements. Technical Requirements
Northwind Traders identifies the following technical requirements:
1. A single dataset must support all three reports. 2. The reports must be stored in a single Power BI workspace. 3. Report data must be current as of 7 AM Pacific Time each day. 4. The reports must provide fast response times when users interact with a visualization. 5. The data model must minimize the size of the dataset as much as possible, while meeting the report requirements and the technical requirements.
Requirements. Security Requirements
Access to the reports must be granted to Azure Active Directory (Azure AD) security groups only. An Azure AD security group exists for each department.
The sales department must be able to perform the following tasks in Power BI:
1. Create, edit, and delete content in the reports. 2. Manage permissions for workspaces, datasets, and report. 3. Publish, unpublish, update, and change the permissions for an app. 4. Assign Azure AD groups role-based access to the reports workspace.
Users in the sales department must be able to access only the data of the sales region to which they are assigned in the Sales Employees table.
Power BI has the following row-level security (RLS) Table filter DAX expression for the Sales Employees table.
[EmailAddress] = USERNAME()
RLS will be applied only to the sales department users. Users in all other departments must be able to view all the data.
Question 44
Testlet 3Single choice
You need to configure access for the sales department users.
The solution must me meet the security requirements.
What should you do?
A
Add the sales department as a member of the reports workspace
B
Add the Azure Active Directory group of the sales department as an Admin of the reports workspace.
C
Distribute an app to the users in the Azure Active Directory group of the sales department.
D
Share each report to the Azure Active Directory group of the sales department.
Reveal answer detailsClose answer details
Correct answerC
Question 45
Single choice
You have a Power BI semantic model named Model1 that runs in Import storage mode.
You need to reduce the size of Model1. The solution must NOT increase report query response times.
What should you do?
A
Remove unnecessary columns.
B
Unpivot unnecessary columns.
C
Rename unnecessary columns.
D
Change Model1 to DirectQuery storage mode.
Reveal answer detailsClose answer details
Correct answerA
Question 46
Hotspot
HOTSPOT
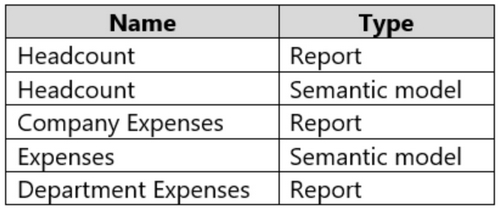
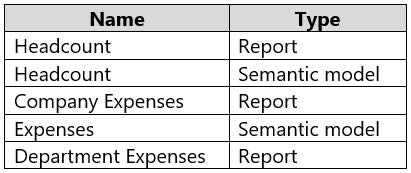
You have a Fabric workspace that contains the items shown in the following table.
You need to make content available to the management department and the accounting department at your company.
The solution must meet the following requirements:
1. The management department must have view access to the Headcount and Department Expenses reports. 2. The management department must NOT be able to view any other current or future reports. 3. The management department must NOT be able to build new reports by using the semantic models. 4. The accounting department must only be able to view the Company Expenses report. 5. The accounting department must be able to build new reports by using the Expenses semantic model.
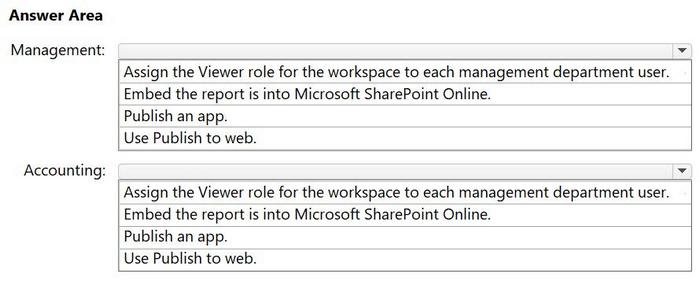
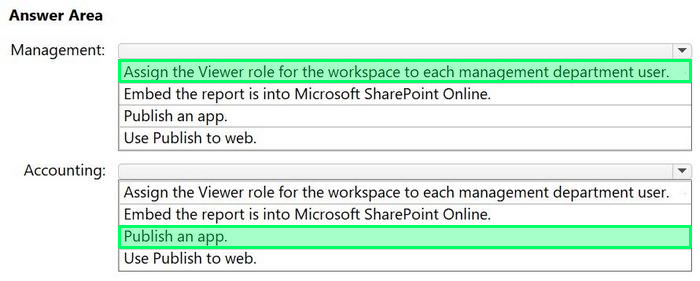
The solution must follow the principle of least privilege and minimize administrative effort.
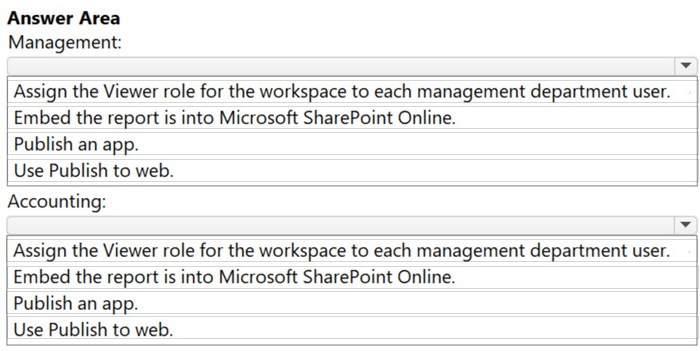
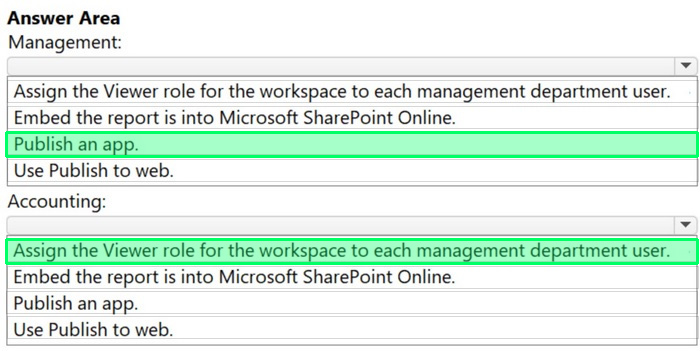
How should you make the content available to the users in each department? To answer, select the appropriate options in the answer area.
NOTE: Each collect selection is worth one point.
Reveal answer detailsClose answer details
Question 47
Hotspot
HOTSPOT
You have a Power BI semantic model named ModelA that contains the following columns:
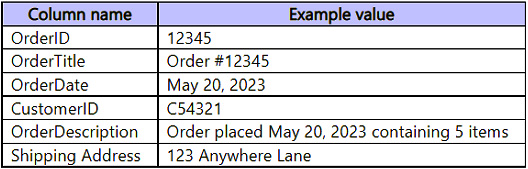
All of the columns use the Text data type.
Based on the model, you create a report named ReportA that contains the following columns: 1. OrderID 2. OrderDate 3. CustomerID 4. ShippingAddress
ReportA is the only report connected to ModelA. You discover that ReportA has performance issues caused by the size of ModelA.
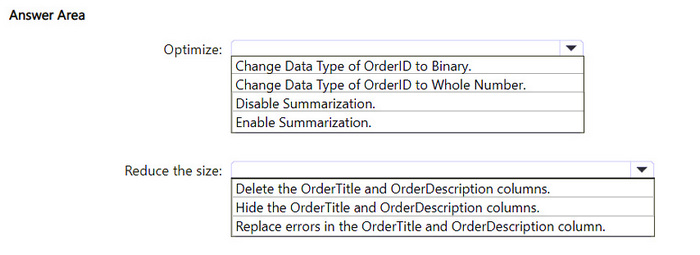
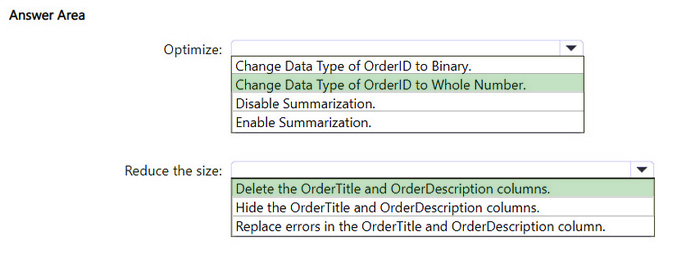
What should you do to optimize and reduce the size of ModelA? To answer, select the appropriate options in the answer area.
NOTE: Each correct selection is worth one point.
Reveal answer detailsClose answer details
Question 48
Hotspot
HOTSPOT
You have a report in Power BI Desktop.
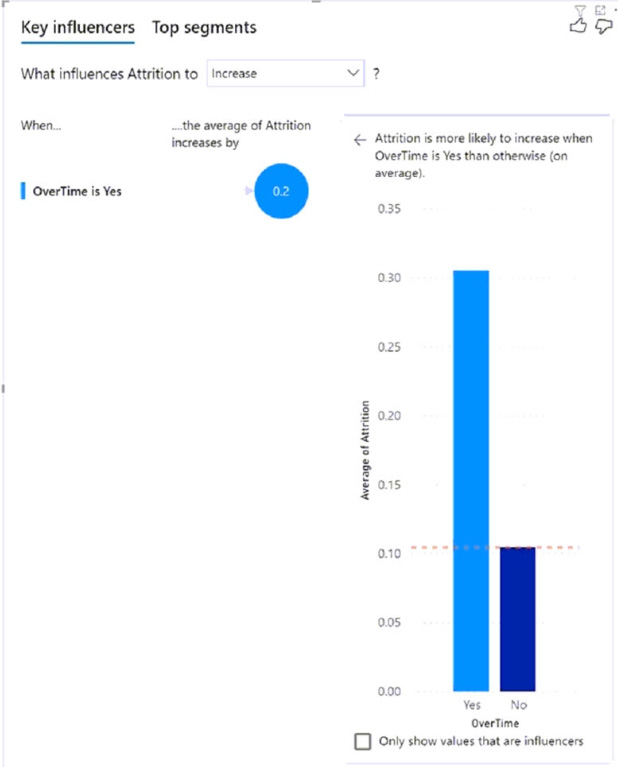
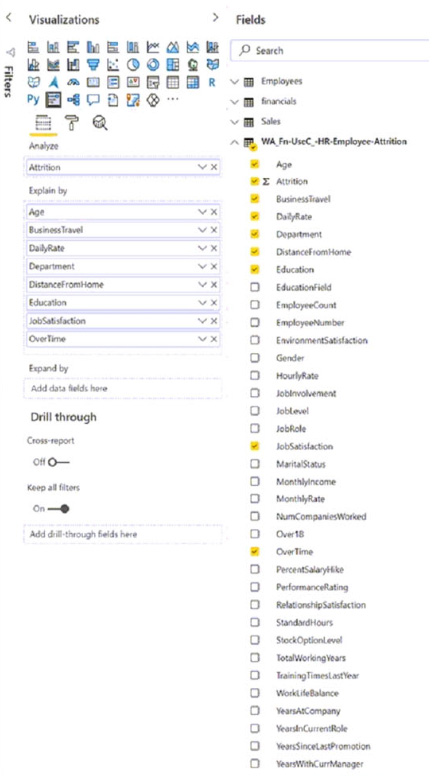
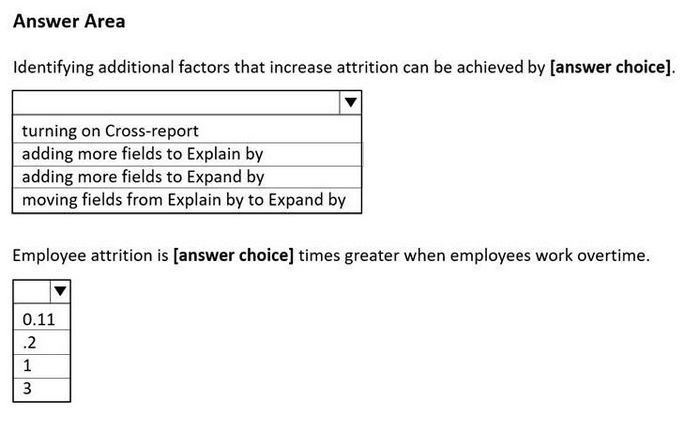
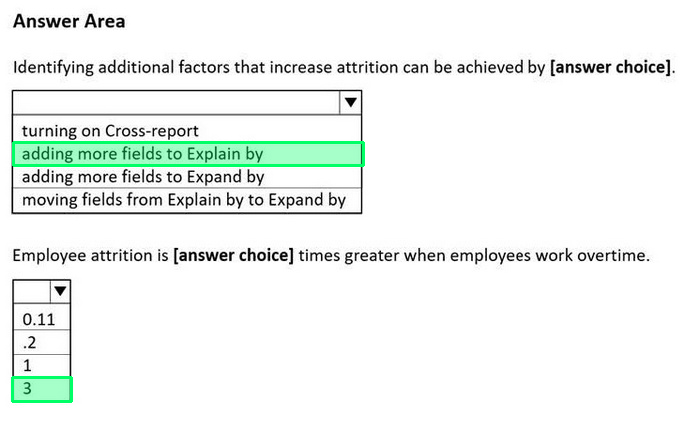
You add a key influencers visual as shown in the exhibit. (Click the Exhibit tab.)
Use the drop-down menus to select the answer choice that completes each statement based on the information presented in the graphic.
NOTE: Each correct selection is worth one point.
Reveal answer detailsClose answer details
Question 49
Single choice
Your company has training videos that are published to Microsoft Stream. You need to surface the videos directly in a Microsoft Power BI dashboard.
Contoso, Ltd. is a manufacturing company that produces outdoor equipment. Contoso has quarterly board meetings for which financial analysts manually prepare Microsoft Excel reports, including profit and loss statements for each of the company's four business units, a company balance sheet, and net income projections for the next quarter.
Existing Environment
Data and Sources
Data for the reports comes from three sources. Detailed revenue, cost, and expense data comes from an Azure SQL database. Summary balance sheet data comes from Microsoft Dynamics 365 Business Central. The balance sheet data is not related to the profit and loss results, other than they both relate dates.
Monthly revenue and expense projections for the next quarter come from a Microsoft SharePoint Online list. Quarterly projections relate to the profit and loss results by using the following shared dimensions: date, business unit, department, and product category.
Net Income Projection Data
Net income projection data is stored in a SharePoint Online list named Projections in the format shown in the following table.
Revenue projections are set at the monthly level and summed to show projections for the quarter.
Balance Sheet Data
The balance sheet data is imported with final balances for each account per month in the format shown in the following table.
There is always a row for each account for each month in the balance sheet data.
Dynamics 365 Business Central Data
Business Central contains a product catalog that shows how products roll up to product categories, which roll up to business units.
Revenue data is provided at the date and product level. Expense data is provided at the date and department level.
Business Issues
Historically, it has taken two analysts a week to prepare the reports for the quarterly board meetings. Also, there is usually at least one issue each quarter where a value in a report is wrong because of a bad cell reference in an Excel formula. On occasion, there are conflicting results in the reports because the products and departments that roll up to each business unit are not defined consistently.
Requirements
Planned Changes
Contoso plans to automate and standardize the quarterly reporting process by using Microsoft Power BI. The company wants to how long it takes to populate reports to less than two days. The company wants to create common logic for business units, products, and departments to be used across all reports, including, but not limited, to the quarterly reporting for the board.
Technical Requirements
Contoso wants the reports and datasets refreshed with minimal manual effort.
The company wants to provide a single package of reports to the board that contains custom navigation and links to supplementary information.
Maintenance, including manually updating data and access, must be minimized as much as possible.
Security Requirements
The reports must be made available to the board from powerbi.com. An Azure Active Directory group will be used to share information with the board.
The analysts responsible for each business unit must see all the data the board sees, except the profit and loss data, which must be restricted to only their business unit's data. The analysts must be able to build new reports from the dataset that contains the profit and loss data, but any reports that the analysts build must not be included in the quarterly reports for the board. The analysts must not be able to share the quarterly reports with anyone.
Report Requirements
You plan to relate the balance sheet to a standard date table in Power BI in a many-to-one relationship based on the last day of the month. At least one of the balance sheet reports in the quarterly reporting package must show the ending balances for the quarter, as well as for the previous quarter.
Projections must contain a column named RevenueProjection that contains the revenue projection amounts. A relationship must be created from Projections to a table named Date that contains the columns shown in the following table.
The definitions and attributes of products, departments, and business units must be consistent across all reports.
The board must be able to get the following information from the quarterly reports:
1. Revenue trends over time 2. Ending balances for each account 3. A comparison of expenses versus projections by quarter 4. Changes in long-term liabilities from the previous quarter 5. A comparison of quarterly revenue versus the same quarter during the prior year
Question 50
Testlet 2Hotspot
HOTSPOT
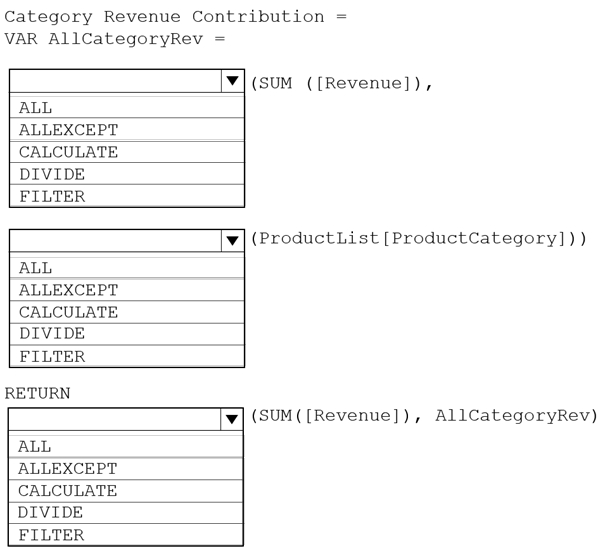
You need to create a measure that returns the percent of revenue by product category.
How should you complete the measure? To answer, select the appropriate options in the answer area.
NOTE: Each correct selection is worth one point.
Reveal answer detailsClose answer details
Question 51
Hotspot
HOTSPOT
You are creating an analytics report that will consume data from the tables shown in the following table.
There is a relationship between the tables.
There are no reporting requirements on employee_id and employee_photo.
You need to optimize the data model.
What should you configure for employee_id and employee_photo? To answer, select the appropriate options in the answer area.
NOTE: Each correct selection is worth one point.
Reveal answer detailsClose answer details
Explanation
Box 1: Hide Optimize data by hiding fields and sorting visualization data
Box 2: Delete The fastest way to optimize your Power BI report is to limit the number of columns to only the ones you need in your data model. Go through your tables in Power Query and determine what fields are being used. Delete these columns if they are not being used in any of your reports or calculations.
You plan to create the chart shown in the following exhibit.
How should you create the dashed horizontal line denoting the 40th percentile of daily sales for the period shown?
A
Create a horizontal line that has a fixed value of 24,000.
B
Add a measure to the visual that uses the following DAX expression. Measure1 = PERCENTILEX.EXC (Sales,sales[Total Sales],0.40)
C
Add a new percentile line that uses Total Sales as the measure and 40% as the percentile.
D
Add a measure to the visual that uses the following DAX expression. Measure1 = PERCENTILEX.INC (Sales,sales[Total Sales],0.40)
Reveal answer detailsClose answer details
Correct answerC
Explanation
The analytics feature enables you to show percentiles across groups specified along a specific axis.
Example: 1. Click on the analytics tab 2. Select Percentile 3. You can choose a specific percentile along with other formatting options. 4. Drag a date or non-numeric dimension into the Axis of a column chart
Add percentile lines to monitor daily revenue
Question 53
Hotspot
HOTSPOT
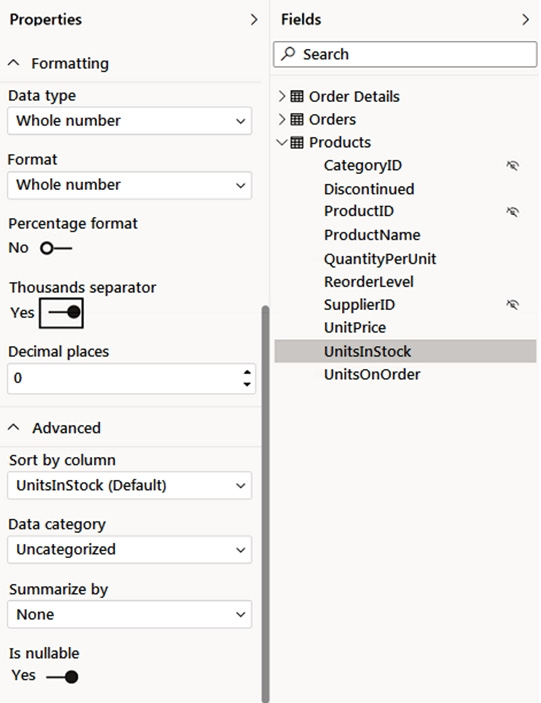
You have a column named UnitsInStock as shown in the following exhibit.
UnitsInStock has 75 non-null values, of which 51 are unique.
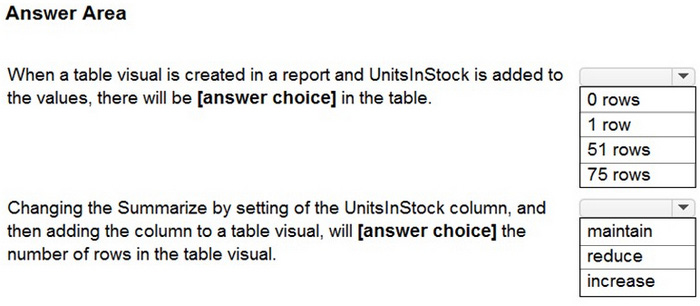
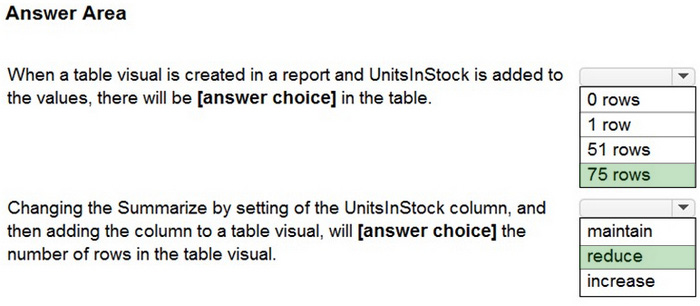
Use the drop-down menus to select the answer choice that completes each statement based on the information presented in the graphic.
NOTE: Each correct selection is worth one point.
Reveal answer detailsClose answer details
Explanation
Box 1: 75
Box 2: reduce They reduce from the number of values (75), to the number of unique values (51).
You have a Power Bl semantic model named Model! that contains two fields named Sales and Quarter. Model 1 contains a DAX measure that sums the Sales column.
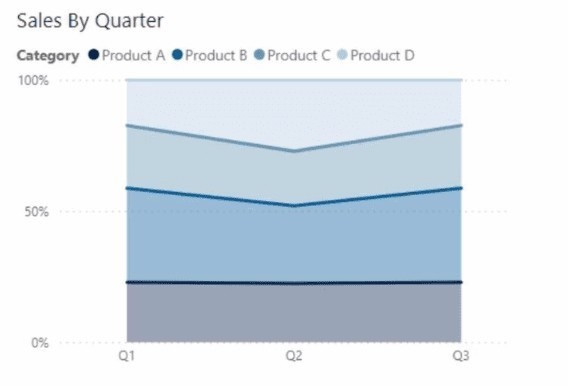
You need to create a report that will contain the visual shown in the following exhibit.
The solution must NOT require additional DAX measures.
Which type of visual should you use?
A
ribbon chart
B
line chart
C
100% stacked area chart
D
area chart
Reveal answer detailsClose answer details
Correct answerD
Question 55
Hotspot
HOTSPOT
You have a semantic model that has the relationships shown in the following exhibit.
Use the drop-down menus to select the answer choice that completes each statement based on the information presented in the graphic.
NOTE: Each correct selection is worth one point.
Reveal answer detailsClose answer details
Question 56
Single choice
You are creating a dashboard by using the Power Bl service.
You have an existing report page that contains three charts.
You need to add the charts to the dashboard while maintaining the interactivity between the charts.
What should you do?
A
Pin each chart as a tile.
B
Edit interactions in the report and set all interactions to Filter
C
Edit the dashboard theme and pin each chart as a file.
D
Pin the report page as a live tile.
Reveal answer detailsClose answer details
Correct answerD
Question 57
Single choice
You have a Power BI report that contains a card. The card displays the value for year-to-date revenue.
You need to ensure that screen reader users can read the value when initially interacting with the card. The value must stay updated as the dataset is refreshed.
What should you do?
A
Convert the card into a text box.
B
Add the value to the chart title text.
C
Populate the alt text with a static value.
D
Populate the alt text by using conditional formatting with a DAX measure.
Reveal answer detailsClose answer details
Correct answerD
Question 58
Single choice
Note: This question is part of a series of questions that present the same scenario. Each question in the series contains a unique solution that might meet the stated goals. Some question sets might have more than one correct solution, while others might not have a correct solution.
After you answer a question in this section, you will NOT be able to return to it. As a result, these questions will not appear in the review screen.
You are modeling data by using Microsoft Power BI. Part of the data model is a large Microsoft SQL Server table named Order that has more than 100 million records. During the development process, you need to import a sample of the data from the Order table.
Solution: You add a WHERE clause to the SQL statement.
Does this meet the goal?
A
Yes
B
No
Reveal answer detailsClose answer details
Correct answerA
Explanation
The WHERE clause has its effects before the data is imported.
You are creating a Microsoft Power Bl imported data model to perform basket analysis. The goal of the analysis is to identify which products are usually bought together in the same transaction across and within sales territories. You import a fact table named Sales as shown in the exhibit. (Click the Exhibit tab.)
The related dimension tables are imported into the model.
Sales contains the data shown in the following table.
Reveal answer detailsClose answer details
Question 60
Hotspot
HOTSPOT
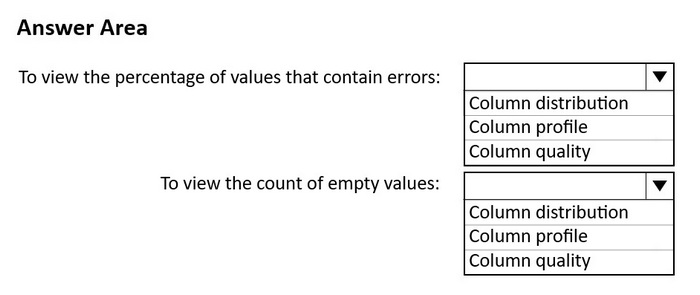
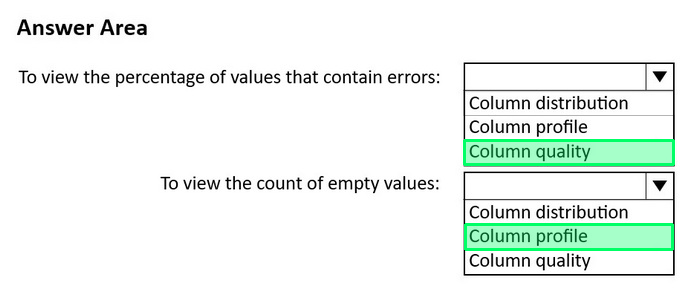
You use Power Query Editor to review a query that contains a column named Country.
You need to view the following information in the Data preview view for the Country column: 1. The percentage of values that contain errors. 2. The count of empty values.
What should you enable? To answer, select the appropriate options in the answer area.
NOTE: Each correct selection is worth one point.
Reveal answer detailsClose answer details
Question 61
Hotspot
HOTSPOT
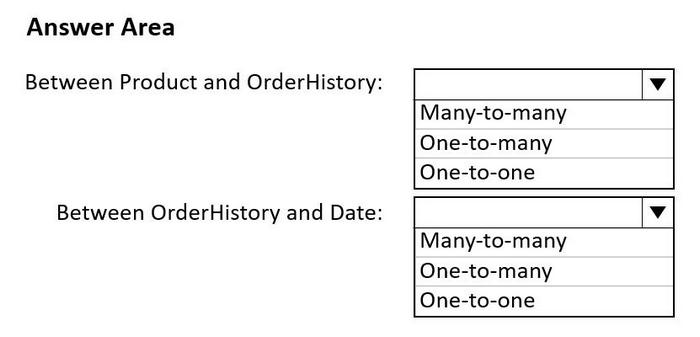
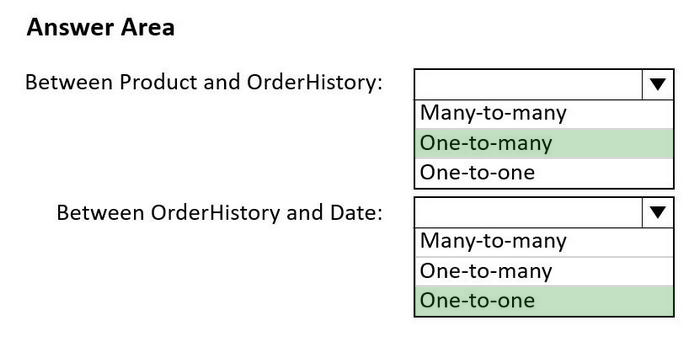
You have a Power BI semantic model that contains three tables named Products, OrderHistory, and Date. The Products table is a dimension table that contains the following columns: 1. ProductID 2. ProductName
The OrderHistory table is a fact table that contains the following columns: 1. OrderID 2. ProductID 3. OrderDate
The Date table is a dimension table that contains the following columns: 1. Year 2. Date 3. Week 4. Month
You need to define a relationship from Products to OrderHistory and from OrderHistory to Date.
Which cardinality should you configure? To answer, select the appropriate options in the answer area.
NOTE: Each correct answer is worth one point.
Reveal answer detailsClose answer details
Question 62
Hotspot
HOTSPOT
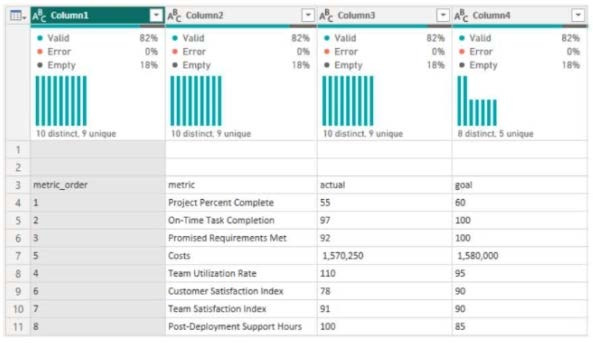
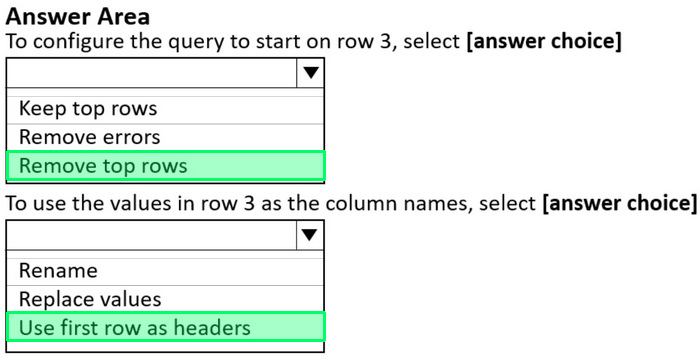
You use Power Query Editor to preview the data shown in the following exhibit.
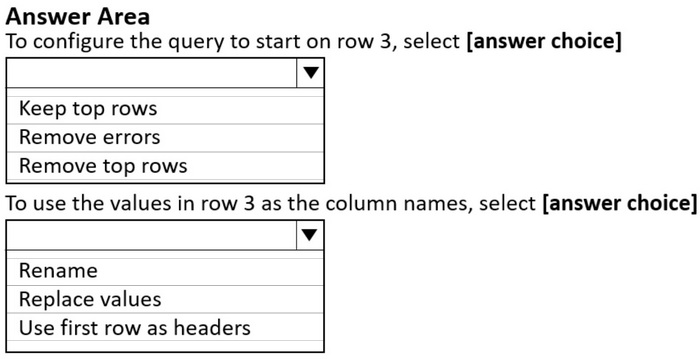
You confirm that the data will always start on row 3, and row 3 will always contain the column names.
How should you shape the query? To answer, select the appropriate options in the answer area.
NOTE: Each correct selection is worth one point.
Reveal answer detailsClose answer details
Question 63
Multiple choice
You have a Power Bl workspace named Inventory that contains a dataset a report and a dashboard. You need to add an additional tile to the dashboard. The tile must show inventory by location. This information is NOT visualized in the report. The solution must minimize the impact on the report. Which of following two actions should you perform? Each correct answer presents part of the solution. NOTE: Each correct selection is worth one point.
A
Add the visual to the report.
B
Ask a question by using Q&A.
C
Pin the visual to the dashboard.
D
Use quick insights on the dashboard.
Reveal answer detailsClose answer details
Correct answersB, C
Question 64
Hotspot
HOTSPOT
You have a Fabric workspace that contains the items shown in the following table.
You need to make content available to the management department and the accounting department at your company. The solution must meet the following requirements: 1. The management department must have view access to the Headcount and Department Expenses reports. 2. The management department must NOT be able to view any other current or future reports. 3. The management department must NOT be able to build new reports by using the semantic models. 4. The accounting department must only be able to view the Company Expenses report. 5. The accounting department must be able to build new reports by using the Expenses semantic model.
The solution must follow the principle of least privilege and minimize administrative effort.
How should you make the content available to the users in each department? To answer, select the appropriate options in the answer area.
NOTE: Each collect selection is worth one point.
Reveal answer detailsClose answer details
Question 65
Drag & drop
DRAG DROP
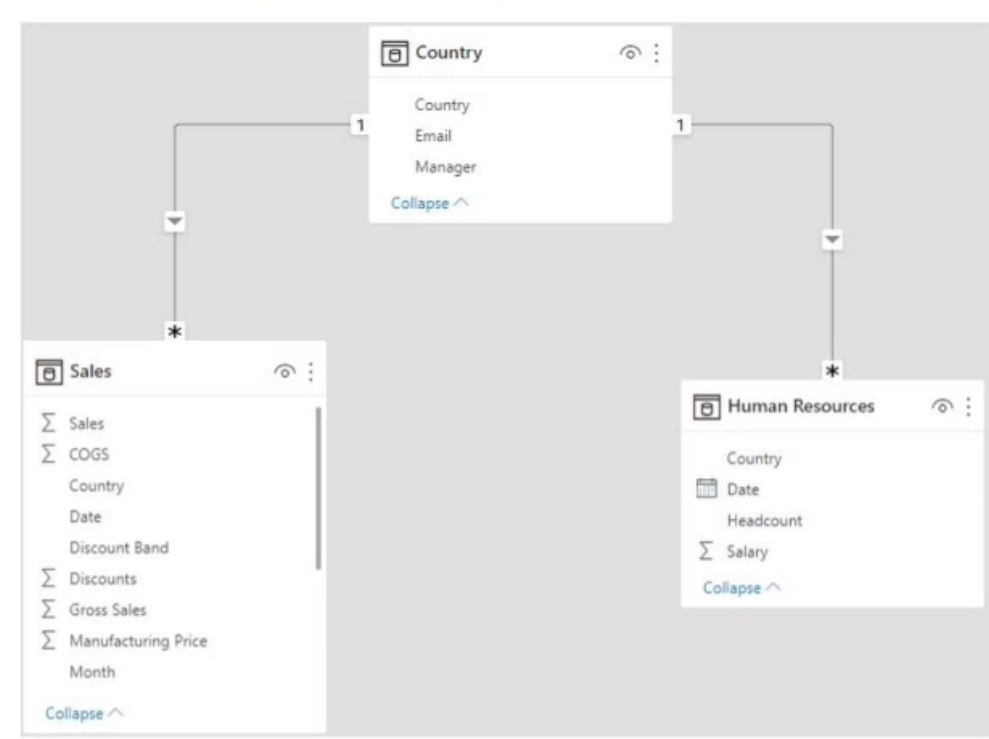
You have the Power Bl data model shown in the following exhibit.
You create two row-level security (RlS) roles named Manager and CFO.
You plan to publish the dataset to the Power Bl service.
You need to create DAX expressions for the RLS filters. The solution must meet the following requirements:
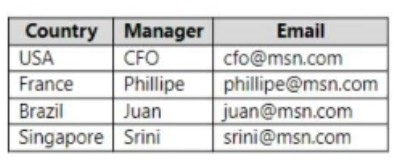
1. Each manager must see only the data in the Sales and Human Resources tables for their own country. 2. The CFO must be prevented from seeing the data in the Human Resources table. 3. The CFO must see the sales data of all countries.
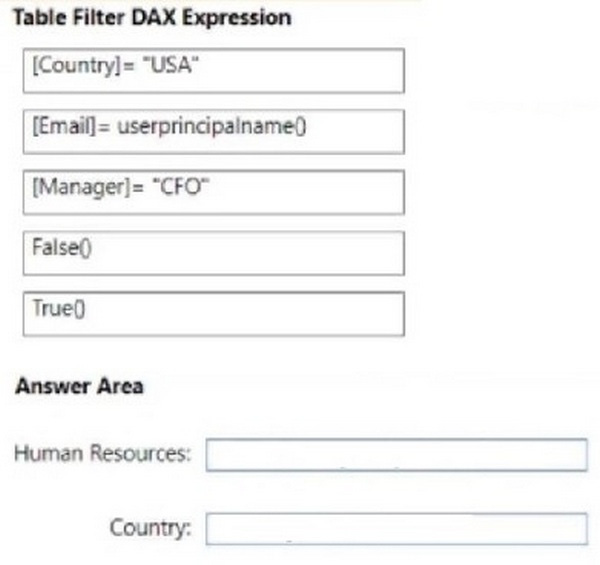
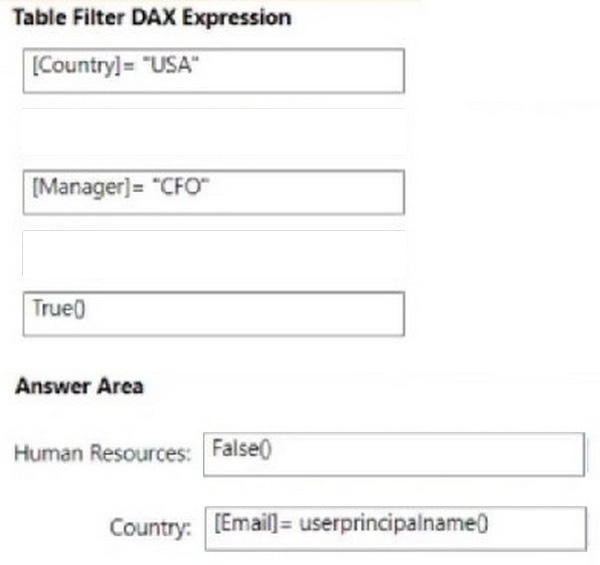
How should you complete the DAX expressions to meet the requirements? To answer, drag the
appropriate expressions to the correct targets. Each expression may be used once, more than once, or not at all. You may need to drag the split bar between panes or scroll to view content.
NOTE: Each correct selection is worth one point.
The Country table contains the following data.
You plan to publish the dataset to the Power Bl service.
You need to create DAX expressions for the RLS filters. The solution must meet the following requirements:
1. Each manager must see only the data in the Sales and Human Resources tables for their own country. 2. The CFO must be prevented from seeing the data in the Human Resources table. 3. The CFO must see the sales data of all countries.
How should you complete the DAX expressions to meet the requirements? To answer, drag the appropriate expressions to the correct targets. Each expression may be used once, more than once, or not at all. You may need to drag the split bar between panes or scroll to view content.
NOTE: Each correct selection is worth one point.
Reveal answer detailsClose answer details
Question 66
Hotspot
HOTSPOT
You need to create a visualization to meet the reporting requirements of the sales managers.
How should create the Visualization? TO answer, select the appropriate options in the answer area.
Reveal answer detailsClose answer details
Question 67
Drag & drop
DRAG DROP
You have a Microsoft Power BI data model that contains three tables named Sales, Product, and Date.
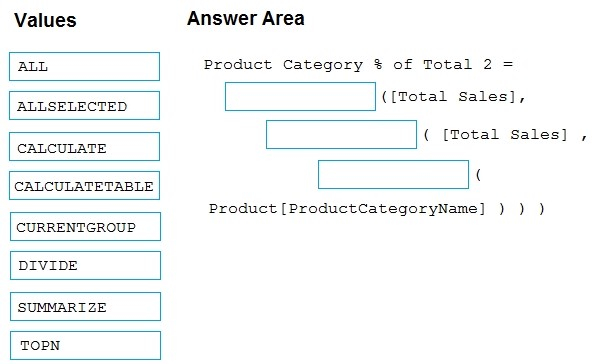
The Sales table has an existing measure named [Total Sales] that sums the total sales from the Sales table.
You need to write a calculation that returns the percentage of total sales that a selected ProductCategoryName value represents. The calculation must respect any slicers on ProductCategoryName and must show the percentage of visible total sales. For example, if there are four ProductCategoryName values, and a user filters one out, a table showing ProductCategoryName and the calculation must sum up to 100 percent.
How should you complete the calculation? To answer, drag the appropriate values to the correct targets. Each value may be used once, more than once, or not at all. You may need to drag the split bar between panes or scroll to view content.
NOTE: Each correct selection is worth one point.
Reveal answer detailsClose answer details
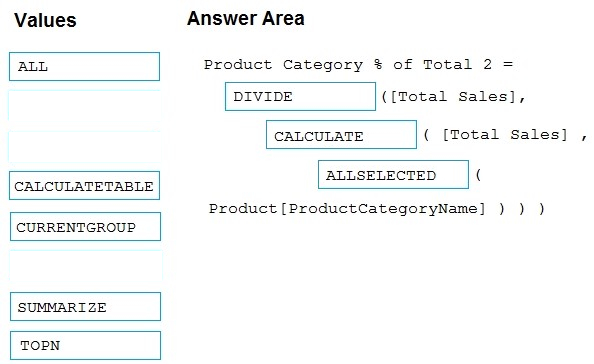
Explanation
Box 1: DIVIDE
As a data modeler, when you write a DAX expression to divide a numerator by a denominator, you can choose to use the DIVIDE function or the divide operator (/ - forward slash). When using the DIVIDE function, you must pass in numerator and denominator expressions.
Box 2: CALCULATE CALCULATE rvaluates an expression in a modified filter context.
Box 3: ALLSELECTED ALLSELECTED removes context filters from columns and rows in the current query, while retaining all other context filters or explicit filters. The ALLSELECTED function gets the context that represents all rows and columns in the query, while keeping explicit filters and contexts other than row and column filters. This function can be used to obtain visual totals in queries.
You need to configure row-level security (RLS) to restrict data access for users that have the Viewer permissions.
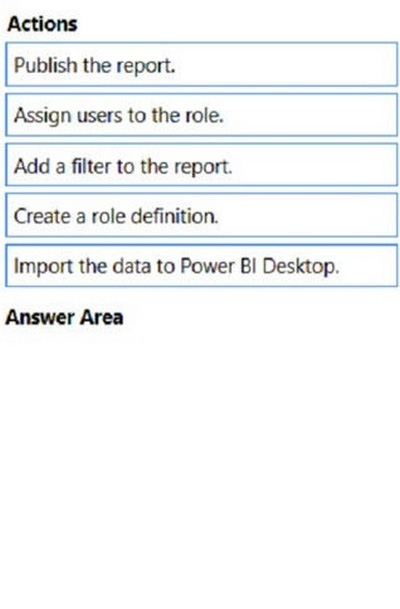
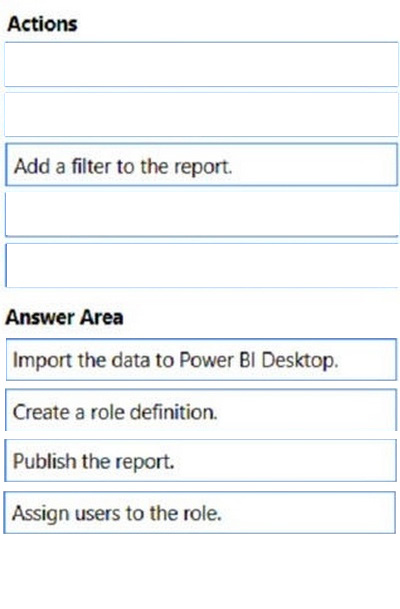
Which three actions should you perform in sequence? To answer, move the appropriate actions from the list of actions to the answer area and arrange them in the correct order.
Reveal answer detailsClose answer details
Question 69
Single choice
You need to create a Power BI theme that will be used in multiple reports. The theme will include corporate branding for font size, color, and bar chart formatting.
What should you do?
A
From Power Bl Desktop, customize the current theme,
B
From power Bl Desktop, use a built in report theme.
C
Create a theme as a JSON file and import the theme into Power Bl Desktop.
D
Create a theme as a PBIVlZ file and import the theme into Power Bl Desktop.
Reveal answer detailsClose answer details
Correct answerC
Question 70
Single choice
You have the visual shown in the exhibit. (Click the Exhibit tab.)
You need to show the relationship between Total Cost and Total Sales over time.
What should you do?
A
Add a play axis.
B
Add a slicer for the year.
C
From the Analytics pane, add an Average line.
D
Create a DAX measure that calculates year-over-year growth.
Reveal answer detailsClose answer details
Correct answerA
Explanation
When to use a slicer Slicers are a great choice when you want to: Display commonly used or important filters on the report canvas for easier access. Make it easier to see the current filtered state without having to open a drop-down list. Filter by columns that are unneeded and hidden in the data tables. Create more focused reports by putting slicers next to important visuals. Note: Suppose you want your report readers to be able to look at overall sales metrics, but also highlight performance for individual district managers and different time frames. You could create separate reports or comparative charts. You could add filters in the Filters pane. Or you could use slicers. Slicers are another way of filtering. They narrow the portion of the dataset that is shown in the other report visualizations.
You have a PBiX file that imports several tables from an Azure SQL database.
The data will be migrated to another Azure SQL database.
You need to change the connections in the PBIX file. The solution must minimize administrative effort.
What should you do?
A
From Power Query Editor, modify the source of each query.
B
Create a PBiT file, open the file, and change the data sources when prompted
C
From Power Query Editor, create new queries.
D
Modify the Data source settings.
Reveal answer detailsClose answer details
Correct answerD
Question 72
Single choice
You build a report to help the sales team understand its performance and the drivers of sales. The team needs to have a single visualization to identify which factors affect success.
Which type of visualization should you use?
A
Key influences
B
Funnel chart
C
Q&A
D
Line and clustered column chart
Reveal answer detailsClose answer details
Correct answerA
Explanation
The key influencers visual helps you understand the factors that drive a metric you're interested in. It analyzes your data, ranks the factors that matter, and displays them as key influencers.
The key influencers visual is a great choice if you want to: See which factors affect the metric being analyzed. Contrast the relative importance of these factors. For example, do short-term contracts have more impact on churn than long-term contracts?
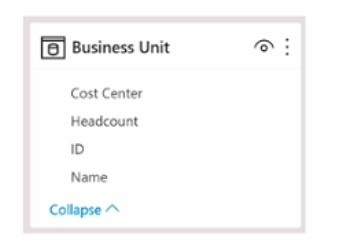
You create a Power Bl dataset that contains the table shown in the following exhibit.
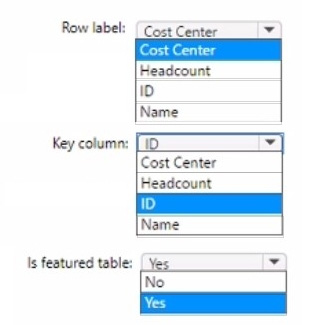
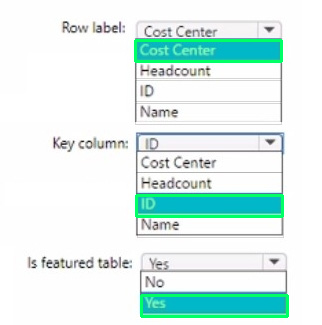
You need to make the table available as an organizational data type In Microsoft Excel.
How should you configure the properties of the table? To answer select the appropriate options in the answer area.
NOTE: Each correct selection is worth one point.
Reveal answer detailsClose answer details
Question 74
Drag & drop
DRAG DROP
You build a report about warehouse inventory data. The dataset has more than 10 million product records from 200 warehouses worldwide.
You have a table named Products that contains the columns shown in the following table.
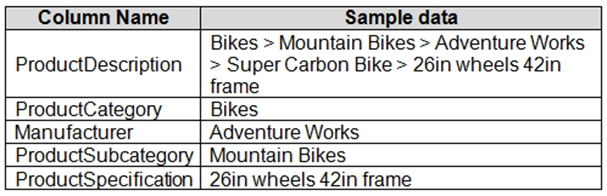
Warehouse managers report that it is difficult to use the report because the report uses only the product name in tables and visuals. The product name is contained within the ProductDescription column and is always the fourth value.
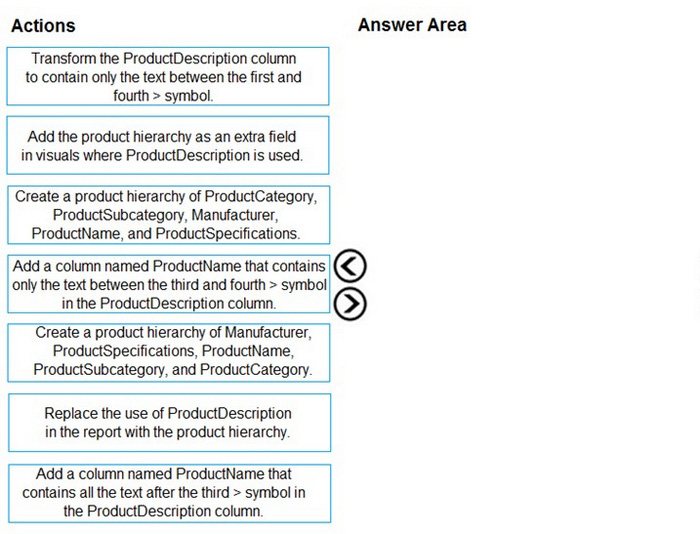
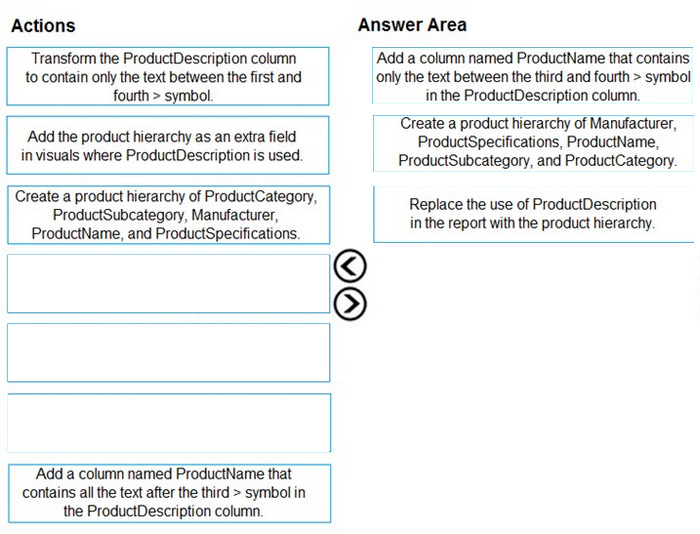
You need to modify the report to support the warehouse managers requirement to explore inventory levels at different levels of the product hierarchy. The solution must minimize the model size.
Which three actions should you perform in sequence? To answer, move the appropriate actions from the list of actions to the answer area and arrange them in the correct order.
Reveal answer detailsClose answer details
Explanation
Power BI Desktop supports the use of inline hierarchy labels. With inline hierarchy labels, you can see hierarchy labels as you expand visuals using the Expand All feature.
You have a data model that contains many complex DAX expressions. The expressions contain frequent references to the RELATED and RELATEDTABLE functions.
You need to recommend a solution to minimize the use of the RELATED and RELATEDTABLE functions.
What should you recommend?
A
Merge tables by using Power Query.
B
Hide unused columns in the model.
C
Split the model into multiple models.
D
Transpose.
Reveal answer detailsClose answer details
Correct answerA
Explanation
Combining data means connecting to two or more data sources, shaping them as needed, then consolidating them into a useful query. When you have one or more columns that you'd like to add to another query, you merge the queries.
Note: The RELATEDTABLE function is a shortcut for CALCULATETABLE function with no logical expression. CALCULATETABLE evaluates a table expression in a modified filter context and returns A table of values.
Note: This question is part of a series of questions that present the same scenario. Each question in the series contains a unique solution that might meet the stated goals. Some question sets might have more than one correct solution, while others might not have a correct solution.
After you answer a question in this section, you will NOT be able to return to it. As a result, these questions will not appear in the review screen.
You are modeling data by using Microsoft Power BI. Part of the data model is a large Microsoft SQL Server table named Order that has more than 100 million records.
During the development process, you need to import a sample of the data from the Order table.
Solution: From Power Query Editor, you import the table and then add a filter step to the query.
Does this meet the goal?
A
Yes
B
No
Reveal answer detailsClose answer details
Correct answerB
Question 77
Single choice
Note: This question is part of a series of questions that present the same scenario. Each question in the series contains a unique solution that might meet the stated goals. Some question sets might have more than one correct solution, while others might not have a correct solution.
After you answer a question in this section, you will NOT be able to return to it. As a result, these questions will not appear in the review screen.
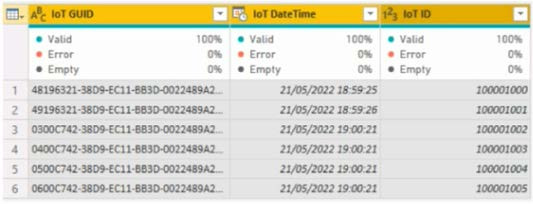
From Power Query Editor, you profile the data shown in the following exhibit.
The IoT GUID and IoT ID columns are unique to each row in query.
You need to analyze IoT events by the hour and day of the year. The solution must improve dataset performance.
Solution: You remove the loT GUID column and retain the loT ID column.
Does this meet the goal?
A
Yes
B
No
Reveal answer detailsClose answer details
Correct answerA
Question 78
Hotspot
HOTSPOT
You have a Power BI report that contains the table visual shown in the following exhibit.
You need to modify the visual to display as shown in the following exhibit.
How should you configure the visual? To answer, select the appropriate options in the answer area.
NOTE: Each correct selection is worth one point.
Reveal answer detailsClose answer details
Question 79
Single choice
You plan to use Power B1 to create sales invoices for customers. The solution must meet the following requirements:
1. Sales invoices must be exported in a PDF format 2. The PDF exports must show all columns and rows clearly.
What should you create?
A
a paginated report that contains a table
B
an interactive report that contains a matrix
C
a dashboard that contains a table
D
an inlet active report that contains a table
Reveal answer detailsClose answer details
Correct answerA
Question 80
Single choice
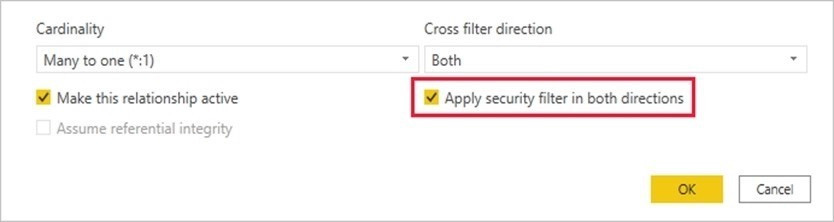
In Power BI Desktop, you are building a sales report that contains two tables. Both tables have row-level security (RLS) configured.
You need to create a relationship between the tables. The solution must ensure that bidirectional cross-filtering honors the RLS settings.
What should you do?
A
Create an active relationship between the tables and select Assume referential integrity.
B
Create an inactive relationship between the tables and select Assume referential integrity.
C
Create an inactive relationship between the tables and select Apply security filter in both directions.
D
Create an active relationship between the tables and select Apply security filter in both directions.
Reveal answer detailsClose answer details
Correct answerD
Explanation
By default, row-level security filtering uses single-directional filters, whether the relationships are set to single direction or bi-directional. You can manually enable bi-directional cross-filtering with row-level security by selecting the relationship and checking the Apply security filter in both directions checkbox.
Select this option when you've also implemented dynamic row-level security at the server level, where row-level security is based on username or login ID.
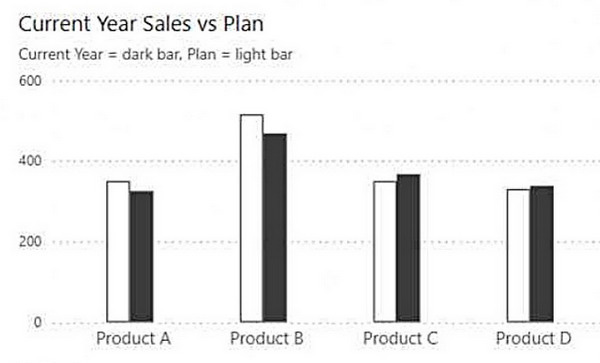
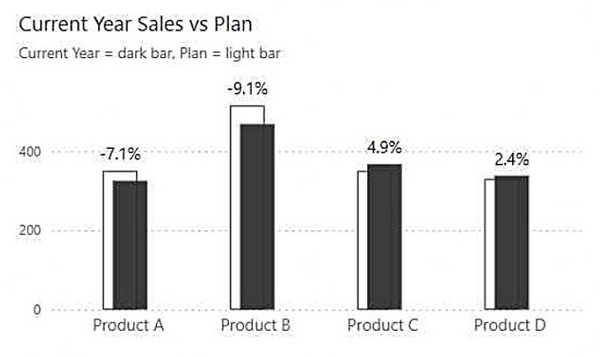
You have a Power BI report that contains the visual shown in the following exhibit.
You plan to modify the visual by changing the column spacing and adding percent change labels as shown in the following exhibit.
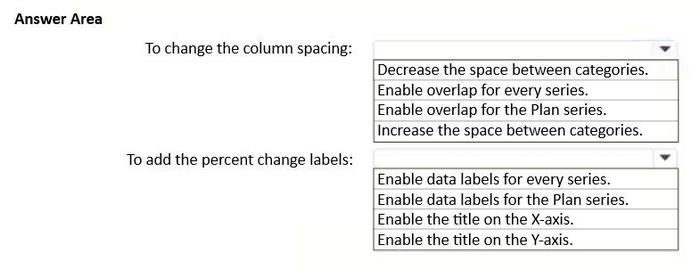
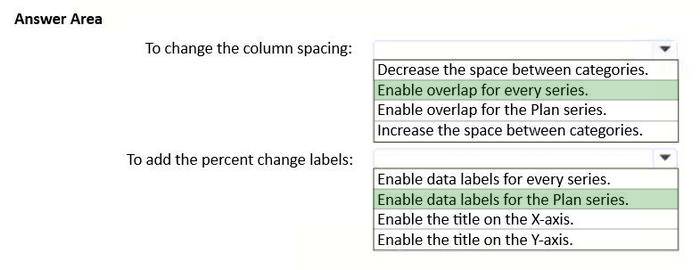
What should you do? To answer, select the appropriate options in the answer area.
NOTE: Each correct selection is worth one point.
Reveal answer detailsClose answer details
Question 82
Drag & drop
DRAG DROP
You plan to create a report that will display sales data from the last year for multiple regions
You need to restrict access to individual rows of the data on a per region-basis by using roles.
Which four actions should you perform in sequence?
To answer, move the appropriate actions from the list of actions to the answer area and arrange them in the correct order.
Reveal answer detailsClose answer details
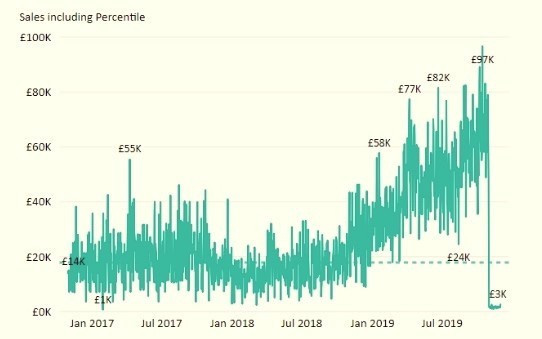
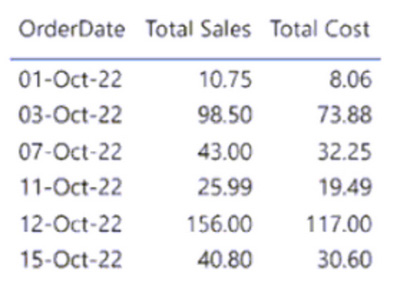
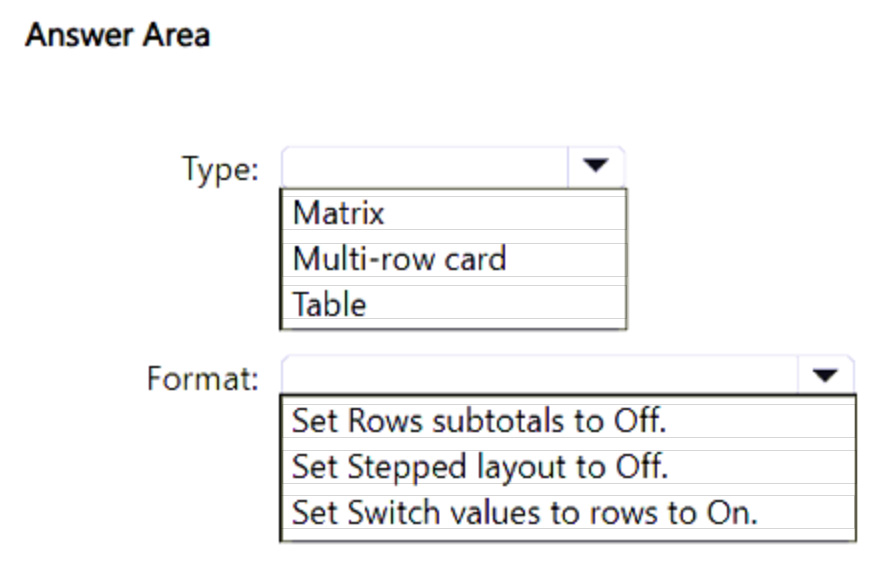
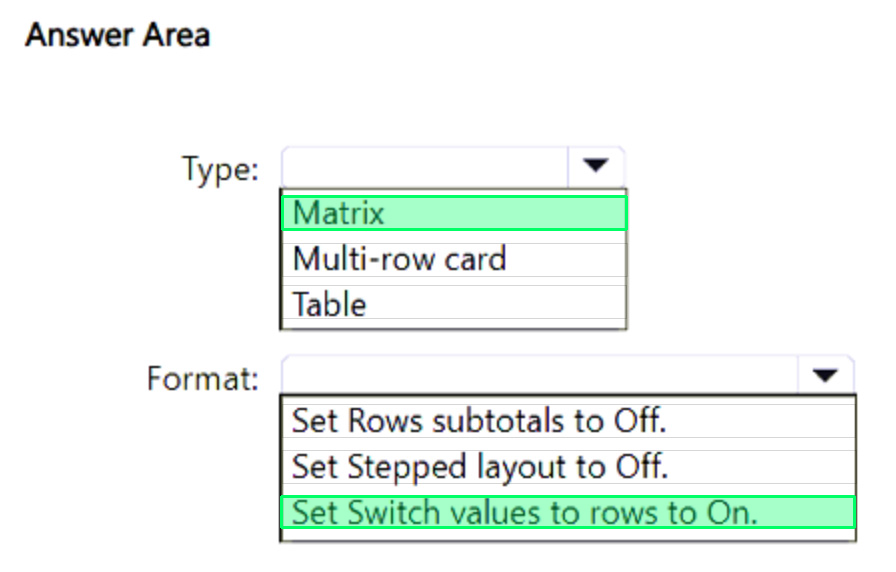
Explanation
You can define roles and rules within Power BI Desktop. When you publish to Power BI, it also publishes the role definitions. To define security roles, follow these steps. 1. Import data into your Power BI Desktop report (Step 1) 2. From the Modeling tab, select Manage Roles. 3. From the Manage roles window, select Create. (Step 2) 4. Under Roles, provide a name for the role. 5. Under Tables, select the table to which you want to apply a DAX rule. 6. In the Table filter DAX expression box, enter the DAX expressions. This expression returns a value of true or false. For example: [Entity ID] = ג€Valueג€(Step 3) 7. After you've created the DAX expression, select the checkmark above the expression box to validate the expression. 8. Select Save. Step 3: Assign Users to the role. You can't assign users to a role within Power BI Desktop. You assign them in the Power BI service. After you've created your roles, test the results of the roles within Power BI Desktop. Step 4: Publish the report. Now that you're done validating the roles in Power BI Desktop, go ahead and publish your report to the Power BI service.
You are profiling data by using Power Query Editor.
The AddressLine2 column in a table named Address is shown in the following exhibit.
Use the drop-down menus to select the answer choice that completes each statement based on the information presented in the graphic.
NOTE: Each correct selection is worth one point.
Correct Answer:
QUESTION 2
HOTSPOT
You have a Power BI semantic model that contains the following tables.
All the tables use the same data source.
You need to reduce the number of limited relationships in the model by changing the storage mode of certain tables. The solution must NOT affect the latency of the data.
Which storage mode should you select for the Customer and Geography tables? To answer, select the appropriate options in the answer area.
NOTE: Each correct selection is worth one point.
Correct Answer:
QUESTION 3
You have a Power 81 semantic model that contains a table named Table1. Table1 runs in Import storage mode.
You need to update the model to change the storage mode of Table1 to DirectQuery.
What should you do?
A.
Delete Table1. and then add the table to the model again in DirectQuery storage mode.
B.
From Power Query Editor, duplicate the query for Table1.
C.
From Model view, change the storage mode of Table1 to DirectQuery
D.
Add an aggregation table to the model.
Correct Answer: C
QUESTION 4
HOTSPOT
You have a Power B1 report that contains the fields shown in the following exhibit.
Use the drop-down menus to select the answer choice that completes each statement based on the
information presented in the graphic.
NOTE: Each correct selection is worth one point.
Correct Answer:
QUESTION 5
You have a semantic model named Model1.
You need to ensure that users can verify that the data in Model1 meets corporate standards.
What should you do?
A.
Create an image of Model1.
B.
Promote Model1.
C.
Certify Model1.
D.
Apply a sensitivity label to Model1.
Correct Answer: C
QUESTION 6
Note: This question is part of a series of questions that present the same scenario. Each question in the series contains a unique solution that might meet the stated goals. Some question sets might have more than one correct solution, while others might not have a correct solution.
After you answer a question in this scenario, you will NOT be able to return to it. As a result, these questions will not appear in the review screen.
You have a clustered bar chart that contains a measure named Salary as the value and a field named Employee as the axis. Salary is present in the data as numerical amount representing US dollars.
You need to create a reference line to show which employees are above the median salary.
Solution: You create a percentile line by using the Salary measure and set the percentile to 50%.
Does this meet the goal?
A.
Yes
B.
No
Correct Answer: A
Explanation
Explanation/Reference:
The 50th percentile is also known as the median or middle value where 50 percent of observations fall below.
You have a Power BI model that contains two tables named Sales and Date. The Sales table relates to the Date table by using a many-to-one relationship.
The Sales table contains the following columns: 1. Date 2. Product 3. SalesAmount
You need to create a DAX measure for a rolling 31-day sales total that will return the total sales amount for a selected date and the previous 30 days.
You create a Power BI report named RPT1 that contains sales data. The data contains 10 million rows. RPT1 contains 15 different visuals.
Users state that RPT1 is slow to load.
You need to investigate the cause of the issue.
What should you use?
A.
Power Query Editor
B.
Performance analyzer
C.
Query Diagnostics
D.
DAX query view
Correct Answer: B
QUESTION 9
Note: This question is part of a series of questions that present the same scenario. Each question in the series contains a unique solution that might meet the stated goals. Some question sets might have more than one correct solution, while others might not have a correct solution.
After you answer a question in this section, you will NOT be able to return to it. As a result, these questions will not appear in the review screen.
You have an on-premises data gateway.
You need to reduce the amount of data sent through the gateway by semantic models that run in Import storage mode.
Solution: You decrease the dashboard cache update frequency.
Does this meet the goal?
A.
Yes
B.
No
Correct Answer: B
QUESTION 10
You use Power BI Desktop to import two tables named Customer and Contacts. The Customer table contains the following columns:
1. Customer_Name 2. Customer ID 3. Website
The Contacts table contains the following columns: 1. Contact ID 2. Contact Email 3. Contact Name 4. Customer Name
A web-based contact form is used to fill the Contacts table. The data is not sanitized.
You need to create a merge for the Customer and Contacts tables.
What should you do?
A.
Disable fuzzy matching.
B.
Enable fuzzy matching.
C.
Set Join Kind to Left Outer.
D.
Set Join Kind to Full Outer
Correct Answer: B
QUESTION 11
You have a Power BI semantic model that contains two tables named DimCustomer and FactOrderDetails.
The primary key of DimCustomer is CustomerID.
FactOrderDetails contains a column named CustomerID that can be used to relate to DimCustomer. Multiple rows in FactOrderDetails possibly have the same CustomerID value.
You need to create a relationship from FactOrderDetails to DimCustomer. The solution must optimize query performance.
What should you create?
A.
an active, single-direction, many-to-one relationship
B.
an inactive, single-direction, one-to-many relationship
C.
an active, single-direction, one-to-many relationship
D.
an active, bi-directional, many-to-one relationship
Correct Answer: A
QUESTION 12
DRAG DROP
You create a data model in Power BI.
Report developers and users provide feedback that the data model is too complex.
The model contains the following tables.
The model has the following relationships:
1. There is a one-to-one relationship between Sales_Region and Region_Manager. 2. There are more records in Manager than in Region_Manager, but every record in Region_Manager has a corresponding record in Manager. 3. There are more records in Sales_Manager than in Sales_Region, but every record in Sales_Region has a corresponding record in Sales_Manager.
You need to denormalize the model into a single table. Only managers who are associated to a sales region must be included in the reports.
Which three actions should you perform in sequence? To answer, move the appropriate actions from the list of actions to the answer area and arrange them in the correct order.
NOTE: More than one order of answer choices is correct. You will receive credit for any of the correct orders you select.
Correct Answer:
Explanation
Explanation/Reference:
1. Merge [Region_Manager] and [Manager] by using an inner join. 3. Merge [Sales_Region] and [Sales_Manager] by using an inner join. 6. Merge [Sales_Region] and [Region_Manager] by using an inner join.
QUESTION 13
HOTSPOT
You import a Microsoft Excel spreadsheet into Power Query Editor and name the query Sales_Spreadsheet.
Sales_Spreadsheet contains the following columns: 1. Customer ID 2. Customer Name 3. Date 4. Total Sales Amount
You plan to use the Sales Spreadsheet query to load two tables named Customer and Sales into the associated semantic model. The tables relate to each other on the Customer ID column of each query. The solution must meet the following requirements: 1. The Customer query must contain the Customer ID and Customer Name columns. 2. The Sales query must contain the Customer ID, Date, and Total Sales Amount columns. 3. Power Query logic must be consolidated to avoid the duplication of logic across the queries and ensure
that only one location is used to update the logic.
You need to identify how to create the Sales query, and what to do to the Sales_Spreadsheet query before loading the model. What should you do? To answer, select the appropriate options in the answer area.
NOTE: Each correct selection is worth one point.
Correct Answer:
QUESTION 14
Note: This question is part of a series of questions that present the same scenario. Each question in the series contains a unique solution that might meet the stated goals. Some question sets might have more than one correct solution, while others might not have a correct solution.
After you answer a question in this section, you will NOT be able to return to it. As a result, these questions
will not appear in the review screen.
You have a Microsoft Excel workbook that is saved to Microsoft SharePoint Online. The workbook contains several Power View sheets.
You need to recreate the Power View sheets as reports in the Power Bl service.
Solution: From the Power Bl service, get the data from SharePoint Online, and then click Connect Does this meet the goal?
Note: This question is part of a series of questions that present the same scenario. Each question in the series contains a unique solution that might meet the stated goals. Some question sets might have more than one correct solution, while others might not have a correct solution.
After you answer a question in this section, you will NOT be able to return to it. As a result, these questions will not appear in the review screen.
You have an on-premises data gateway.
You need to reduce the amount of data sent through the gateway by semantic models that run in import storage mode.
Solution: You increase Automatic page refresh intervals.
Does this meet the goal?
A.
Yes
B.
No
Correct Answer: B
QUESTION 16
HOTSPOT
You have a Power BI semantic model.
You discover that he semantic model contains values that display as errors.
You need to use data profiling feature in Power Query to preview the date and identify the issues.
What should you select to gain into the number of errors in the model, and what should you select to resolve the errors? To answer, select the appropriate options in the answer area.
NOTE: Each correct answer is worth one point.
Correct Answer:
QUESTION 17
You have a Power BI report named Report1. You plan to share Report1 with multiple users.
You need to add the users to a group.
Which two types of groups can you use? Each correct answer presents a complete solution.
NOTE: Each correct selection is worth one point.
A.
security group
B.
distribution group
C.
Microsoft Teams team
D.
Microsoft 365 group
Correct Answer: AD
QUESTION 18
A business intelligence (Bl) developer creates a dataflow in Power Bl that uses DirectQuery to access tables from an on premises Microsoft SQL server. The Enhanced Dataflows Compute Engine is turned on for the dataflow.
You need to use the dataflow in a report. The solution must meet the following requirements:
1. Minimize online processing operations. 2. Minimize calculation times and render times for visuals. 3. include data from the current year, up to and including the previous day.
What should you do?
A.
Create a dataflows connection that has Import mode selected and schedule a dairy refresh.
B.
Create a dataflows connection that has DirectQuery mode selected.
C.
Create a dataflows connection that has DirectQuery mode selected and configure a gateway connection for the dataset
D.
Create a dataflows connection that has Import mode selected and create a Microsoft Power Automate solution to refresh the data hourly.
Correct Answer: A
QUESTION 19
HOTSPOT
You are creating a Microsoft Power BI imported data model to perform basket analysis. The goal of the analysis is to identify which products are usually bought together in the same transaction across and within sales territories.
You import a fact table named Sales as shown in the exhibit. (Click the Exhibit tab.)
The related dimension tables are imported into the model.
Sales contains the data shown in the following table.
You are evaluating how to optimize the model.
For each of the following statements, select Yes if the statement is true. Otherwise, select No.
You have a Power Bl workspace named Workspace1 that contains a dataset named DS1 and a report named RPT1.
A user wants to create a report by using the data In DS1 and publish the report to another workspace.
You need to provide the user with the appropriate access. The solution must minimize the number of access permissions granted to the user.
What should you do?
A.
Share RPT1 with the user.
B.
Add the user as a Viewer of Workspace1.
C.
Add the user as a member of Workspace1.
D.
Grant the Build permission for DS1 to the user.
Correct Answer: D
Explanation
Explanation/Reference:
Microsoft says: To copy a report to another workspace, and to create a report in another workspace based on a dataset in the current workspace, you need Build permission for the dataset. For datasets in the original workspace, if you have at least the Contributor role, you automatically have Build permission through your workspace role. https://learn.microsoft.com/en-us/power-bi/collaborate-share/service-roles-new-workspaces
QUESTION 21
You have a Power B1 report that contains one visual You need to provide users with the ability to change the visual type without affecting the view for other users.
What should you do?
A.
From Tabular Editor, create a new perspective.
B.
From Report settings, select Personalize visuals
C.
From the Bookmarks pane, select Focus mode and then select Add
D.
From Visual options in Report settings, select Use the modem visual header with updated styling options
Correct Answer: B
QUESTION 22
Note: This question is part of a series of questions that present the same scenario. Each question in the series contains a unique solution that might meet the stated goals. Some question sets might have more than one correct solution, while others might not have a correct solution.
After you answer a question in this section, you will NOT be able to return to it. As a result, these questions will not appear in the review screen.
You create a parameter named DataSourceExcel that holds the file name and location of a Microsoft Excel data source. You need to update the query to reference the parameter instead of multiple hard-coded copies of the location within each query definition.
Solution: You modify the source step of the queries to use DataSourceExcel as the file path.
Does this meet the goal?
A.
Yes
B.
No
Correct Answer: A
Explanation
Explanation/Reference:
Parameterising a Data Source could be used in many different use cases. From connecting to different data sources defined in Query Parameters to load different combinations of columns.
You have a Microsoft Exert spreadsheet named Excel1 that contains survey results.
You have a Power Bl dashboard named DashboardA that has Q&A enabled.
You need to ensure that users who can access DashboardA can ask Questions based on the contents of Excel 1 and pm visuals based on their queries to DashboardA. The solution must minimize development time.
Which three actions should you perform in sequence? To answer, move the appropriate actions from the list of actions to the answer area and arrange them in the correct order.
Correct Answer:
QUESTION 24
HOTSPOT
You have an API that returns more than 100 columns. The following is a sample of column names.
You have a Power BI tenant that allows users to export data.
You need to ensure that consumers of ReportA cannot export any data from visuals.
Which two actions should you perform? Each correct answer presents a complete solution.
NOTE: Each correct selection is worth one point.
A.
From Power BI Desktop, modify the Report settings.
B.
From Power BI Desktop, modify the Data Load settings.
C.
From the Power BI service, modify the dataset permissions.
D.
From the Power BI service, modify the Report settings.
Correct Answer: AD
QUESTION 26
You need to create a visual that compares profit across 10 product categories for a selected quarter.
What is the best visual to use to achieve the goal? More than one answer choice may achieve the goal Select the BEST answer.
A.
an area chart
B.
a clustered bar chart
C.
a line chart
D.
a funnel chart
Correct Answer: B
Case Study 3
Case Study Questions
Overview. General Overview
Northwind Traders is a specialty food import company.
The company recently implemented Power BI to better understand its top customers, products, and suppliers.
Overview. Business Issues
The sales department relies on the IT department to generate reports in Microsoft SQL Server Reporting Services (SSRS). The IT department takes too long to generate the reports and often misunderstands the report requirements.
Existing Environment. Data Sources
Northwind Traders uses the data sources shown in the following table.
Source2 is exported daily from a third-party system and stored in Microsoft SharePoint Online.
Existing Environment. Customer Worksheet
Source2 contains a single worksheet named Customer Details. The first 11 rows of the worksheet are shown in the following table.
All the fields in Source2 are mandatory.
The Address column in Customer Details is the billing address, which can differ from the shipping address.
The Order Details table contains the following columns.
The address in the Orders table is the shipping address, which can differ from the billing address.
The Products table contains the following columns.
The Categories table contains the following columns.
The Suppliers table contains the following columns.
The Sales Employees table contains the following columns.
Each employee in the Sales Employees table is assigned to one sales region. Multiple employees can be assigned to each region.
Requirements. Report Requirements
Northwind Traders requires the following reports:
1. Top Products 2. Top Customers 3. On-Time Shipping
The Top Customers report will show the top 20 customers based on the highest sales amounts in a selected order month or quarter, product category, and sales region.
The Top Products report will show the top 20 products based on the highest sales amounts sold in a selected order month or quarter, sales region, and product category. The report must also show which suppliers provide the top products.
The On-Time Shipping report will show the following metrics for a selected shipping month or quarter:
1. The percentage of orders that were shipped late by country and shipping region 2. Customers that had multiple late shipments during the last quarter
Northwind Traders defines late orders as those shipped after the required shipping date.
The warehouse shipping department must be notified if the percentage of late orders within the current month exceeds 5%.
The reports must show historical data for the current calendar year and the last three calendar years.
Requirements. Technical Requirements
Northwind Traders identifies the following technical requirements:
1. A single dataset must support all three reports. 2. The reports must be stored in a single Power BI workspace. 3. Report data must be current as of 7 AM Pacific Time each day. 4. The reports must provide fast response times when users interact with a visualization. 5. The data model must minimize the size of the dataset as much as possible, while meeting the report requirements and the technical requirements.
Requirements. Security Requirements
Access to the reports must be granted to Azure Active Directory (Azure AD) security groups only. An Azure AD security group exists for each department.
The sales department must be able to perform the following tasks in Power BI:
1. Create, edit, and delete content in the reports. 2. Manage permissions for workspaces, datasets, and report. 3. Publish, unpublish, update, and change the permissions for an app. 4. Assign Azure AD groups role-based access to the reports workspace.
Users in the sales department must be able to access only the data of the sales region to which they are assigned in the Sales Employees table.
Power BI has the following row-level security (RLS) Table filter DAX expression for the Sales Employees table.
[EmailAddress] = USERNAME()
RLS will be applied only to the sales department users. Users in all other departments must be able to view all the data.
QUESTION 27
HOTSPOT
You need to create a solution to meet the notification requirements of the warehouse shipping department.
What should you do? To answer, select the appropriate options in the answer area.
NOTE: Each correct select is worth one point:
Correct Answer:
Explanation
Explanation/Reference:
Box 1: dashboard The warehouse shipping department must be notified if the percentage of late orders within the current month exceeds 5%.
You can set alerts to notify you when data in your dashboards changes beyond limits you set.
Box 2: data alert References: https://docs.microsoft.com/en-us/power-bi/create-reports/service-set-data-alerts
QUESTION 28
HOTSPOT
You are profiling data by using Power Query Editor.
You have a table that contains a column named column1. Column statistics and Value distribution for column1 are shown in the following exhibit.
Use the drop-down menus to select the answer choice that completes each statement based on the information presented in the graphic. NOTE: Each correct selection is worth one point.
Correct Answer:
Explanation
Explanation/Reference:
Box 1: are 20 values that occur - There are 20 unique values.
Box 2: Elm, American - Elm, American is below Peer, flowering species in the graphic.
QUESTION 29
DRAG DROP
In Power Query Editor, you have three queries named ProductCategory, ProductSubCategory, and Product.
Every Product has a ProductSubCategory.
Not every ProductsubCategory has a parent ProductCategory.
You need to merge the three queries into a single query. The solution must ensure the best performance in Power Query.
How should you merge the tables? To answer, drag the appropriate merge types to the correct queries. Each merge type may be used once, more than once, or not at all. You may need to drag the split bar between panes or scroll to view content.
NOTE: Each correct selection is worth one point.
Correct Answer:
QUESTION 30
HOTSPOT
You use Power Query Editor to pull data from a Microsoft SharePoint Online list.
You plan to use Advanced Editor to build a Power Query M formula language query.
You need to create a query that loads the data, expands a column named location, and hides a column named CountryOrRegion from the dataset.
How should you complete the query? To answer, select the appropriate options in the answer area.
NOTE: Each correct answer is worth one point.
Correct Answer:
QUESTION 31
You have a Power BI report. The report contains a single report page that uses the default theme.
You need to configure the report page to match the formatting shown in the following exhibit.
What should you change on the report page?
A.
the wallpaper color only
B.
the canvas background color only
C.
the wallpaper color and the canvas background color only
D.
the canvas background image only
Correct Answer: A
QUESTION 32
You have a Power BI model that contains a table named Expenses. The table contains the following columns: 1. Date 2. Amount 3. Category 4. Expense ID 5. Employee ID
Expenses are recorded by employees, and each expense has a unique expense ID.
You need to create a DAX measure that will calculate the total amount of expenses.
Which DAX expression should you use?
A.
Sum('Expenses'[Amount])
B.
Max('Expenses'[Amount])
C.
Sum('Expenses'[Expense ID])
D.
Count('Expenses'[Amount])
Correct Answer: A
QUESTION 33
HOTSPOT
You plan to create a Power Bl dataset to analyze attendance at a school. Data will come from two separate views named View1 and View? in an Azure SQL database. View1 contains the columns shown in the following table.
View2 contains the columns shown in the following table.
The views can be related based on the Class ID column.
Class ID is the unique identifier for the specified class, period, teacher, and school year. For example, the
same class can be taught by the same teacher during two different periods, but the class will have a different class ID.
You need to design a star schema data model by using the data in both views. The solution must facilitate the following analysis:
1. The count of classes that occur by period 2. The count of students in attendance by period by day 3. The average number of students attending a class each month
In which table should you include the Teacher First Name and Period Number fields? To answer, select the appropriate options in the answer area. NOTE: Each correct selection is worth one point.
Correct Answer:
QUESTION 34
HOTSPOT
You use Power Query Editor to review the query shown in the following exhibit.
Each Region value appears only on the row where it first occurred. Each subsequent occurrence of the Region value is blank.
You need to ensure that every row contains the correct non-blank value. The solution must minimize development effort.
Which column should you select, and which action should you perform on the column? To answer, select the appropriate options in the answer area.
NOTE: Each correct selection is worth one point.
Correct Answer:
QUESTION 35
HOTSPOT
You are building a financial report by using Power BI.
You have a table named financials that contains a column named Date and a column named Sales.
You need to create a measure that calculates the relative change in sales as compared to the previous quarter.
How should you complete the measure? To answer, select the appropriate options in the answer area.
NOTE: Each correct selection is worth one point.
Correct Answer:
Explanation
Explanation/Reference:
Box 1: CALCULATE
Box 2: DATEADD
Box 3: DIVIDE
Example: NET_SALES QoQ% = IF( ISFILTERED('Calendar'[Date]), ERROR("Time intelligence quick measures can only be grouped or filtered by the Power BI-provided date hierarchy or primary date column."), VAR__PREV_QUARTER = CALCULATE( SUM('research ra_qtr_template'[NET_SALES]), DATEADD('Calendar'[Date].[Date], -1, QUARTER) )
You have a Power BI semantic model that connects to a streaming data source. The data source is updated frequently.
You need to create a Power BI report that meets the following requirements: 1. Supports real-time analytics 2. Minimizes performance impact on the data source 3. Displays the most recent data without performing a data refresh
Which connectivity mode should you use for the dataset?
A.
DirectQuery mode
B.
import mode
C.
LiveConnect mode
D.
push mode
Correct Answer: D
QUESTION 37
HOTSPOT
You have a semantic model that contains a table named Sales.
The table contains the following columns:
1. Order ID 2. Product ID 3. Sales Dote 4. Sales Amount
You need to create a DAX measure that will return the total sales amount for the same dates from the previous year. How should you complete the measure? To answer, select the appropriate options m the answer area.
NOTE: Each correct selection is worth one point.
Correct Answer:
QUESTION 38
You plan to use Power Bl Desktop to create a bog tracking dashboard that will pull data from Analytics in Azure DevOps.
From Power Bl Desktop, you need to configure a data connector to authenticate to Azure DevOps. The solution must meet the following requirements:
1. Use Analytics views. 2. Filter data from the cloud.
Which connector should you use?
A.
OData queries
B.
Azure DevOps (Boards only)
C.
Azure DevOps Server (Boards only)
D.
OData feed
Correct Answer: B
QUESTION 39
You have the tables shown in the following table.
The Impressions table contains approximately 30 million records per month.
You need to create an ad analytics system to meet the following requirements:
1. Present ad impression counts for the day, campaign, and Site_name. 2. The analytics for the last year are required. 3. Minimize the data model size.
Which two actions should you perform? Each correct answer presents part of the solution.
NOTE: Each correct selection is worth one point.
A.
Group the impressions by Ad_id, Site_name, and Impression_date.Aggregate by using the CountRows function.
B.
Create one-to-many relationships between the tables.
C.
Create a calculated measure that aggregates by using the COUNTROWS function.
D.
Create a calculated table that contains Ad_id, Site_name, and Impression_date.
Correct Answer: AB
Explanation
Explanation/Reference:
Grouping in power query reduces the number of rows in the impression table that is gonna be loaded in the model. Creating relationships doesn't increase the size of the model.
QUESTION 40
You have a Power Bl report hosted on powerbi.com that displays expenses by department for department managers.
The report contains a line chart that shows expenses by month.
You need to enable users to choose between viewing the report as a line chart or a column chart. The solution must minimize development and maintenance effort.
What should you do?
A.
Add a column chart, a bookmark, and a button for users to choose a visual.
B.
Create a mobile report that contains a column chart.
C.
Create a separate report page for users to view the column chart.
D.
Enable report readers to personalize visuals.
Correct Answer: D
Case Study 2
Case Study Questions
Overview
Contoso, Ltd. is a manufacturing company that produces outdoor equipment. Contoso has quarterly board meetings for which financial analysts manually prepare Microsoft Excel reports, including profit and loss statements for each of the company's four business units, a company balance sheet, and net income projections for the next quarter.
Existing Environment
Data and Sources
Data for the reports comes from three sources. Detailed revenue, cost, and expense data comes from an Azure SQL database. Summary balance sheet data comes from Microsoft Dynamics 365 Business Central. The balance sheet data is not related to the profit and loss results, other than they both relate dates.
Monthly revenue and expense projections for the next quarter come from a Microsoft SharePoint Online list. Quarterly projections relate to the profit and loss results by using the following shared dimensions: date, business unit, department, and product category.
Net Income Projection Data
Net income projection data is stored in a SharePoint Online list named Projections in the format shown in the following table.
Revenue projections are set at the monthly level and summed to show projections for the quarter.
Balance Sheet Data
The balance sheet data is imported with final balances for each account per month in the format shown in the following table.
There is always a row for each account for each month in the balance sheet data.
Dynamics 365 Business Central Data
Business Central contains a product catalog that shows how products roll up to product categories, which roll up to business units.
Revenue data is provided at the date and product level. Expense data is provided at the date and department level.
Business Issues
Historically, it has taken two analysts a week to prepare the reports for the quarterly board meetings. Also, there is usually at least one issue each quarter where a value in a report is wrong because of a bad cell reference in an Excel formula. On occasion, there are conflicting results in the reports because the products and departments that roll up to each business unit are not defined consistently.
Requirements
Planned Changes
Contoso plans to automate and standardize the quarterly reporting process by using Microsoft Power BI. The company wants to how long it takes to populate reports to less than two days. The company wants to create common logic for business units, products, and departments to be used across all reports, including, but not limited, to the quarterly reporting for the board.
Technical Requirements
Contoso wants the reports and datasets refreshed with minimal manual effort.
The company wants to provide a single package of reports to the board that contains custom navigation and links to supplementary information.
Maintenance, including manually updating data and access, must be minimized as much as possible.
Security Requirements
The reports must be made available to the board from powerbi.com. An Azure Active Directory group will be used to share information with the board.
The analysts responsible for each business unit must see all the data the board sees, except the profit and loss data, which must be restricted to only their business unit's data. The analysts must be able to build new reports from the dataset that contains the profit and loss data, but any reports that the analysts build must not be included in the quarterly reports for the board. The analysts must not be able to share the quarterly reports with anyone.
Report Requirements
You plan to relate the balance sheet to a standard date table in Power BI in a many-to-one relationship based on the last day of the month. At least one of the balance sheet reports in the quarterly reporting package must show the ending balances for the quarter, as well as for the previous quarter.
Projections must contain a column named RevenueProjection that contains the revenue projection amounts. A relationship must be created from Projections to a table named Date that contains the columns shown in the following table.
The definitions and attributes of products, departments, and business units must be consistent across all reports.
The board must be able to get the following information from the quarterly reports:
1. Revenue trends over time 2. Ending balances for each account 3. A comparison of expenses versus projections by quarter 4. Changes in long-term liabilities from the previous quarter 5. A comparison of quarterly revenue versus the same quarter during the prior year
QUESTION 41
What is the minimum number of datasets and storage modes required to support the reports? (What is the minimum number of Power BI datasets needed to support the reports? )
A.
two imported datasets
B.
a single DirectQuery dataset
C.
two DirectQuery datasets
D.
a single imported dataset
Correct Answer: A
Explanation
Explanation/Reference:
Analysts must be able to create new reports from the dataset that contains the profit and loss data, but the reports built by the analysts must NOT be included in the quarterly reports for the board. Analysts must NOT be able to make new reports by using the balance sheet data. Two datasets are required. Need DAX for: A comparison of quarterly revenue versus the same quarter from the previous year. Also see other questions in this Case study which uses DAX expressions. Incorrect: Not DirectQuery: DirectQuery Limited Transformations. You are not able to use all of the normal Power Query transformation features. Particular DAX functions are not available in this method as well. So if your data is poorly structured or needing lots of transformation, sometimes Direct Query is not a viable option. References:
QUESTION 42
You use an R visual to produce a map of 500,000 customers. You include the values of CustomerID, Latitude, and Longitude in the fields sent to the visual. Each customer ID is unique.
In powerbi.com, when users load the visual, they only see some of the customers.
What is the cause of the issue?
A.
The visual was built by using a different version of R.
B.
The data comes from a Microsoft SQL Server source.
C.
The data is deduplicated.
D.
Too many records were sent to the visual.
Correct Answer: D
Explanation
Explanation/Reference:
R visuals in the Power BI service have a few limitations including: Data size limitations ?data used by the R visual for plotting is limited to 150,000 rows. If more than 150,000 rows are selected, only the top 150,000 rows are used and a message is displayed on the image. Additionally, the input data has a limit of 250 MB.
You plan to generate a line chart to visualize and compare the last six months of sales data for two departments.
You need to increase the accessibility of the visual.
What should you do?
A.
Configure a unique marker for each series.
B.
Configure a distinct color for each series.
C.
Replace long text with abbreviations and acronyms.
D.
Move important information to a tooltip.
Correct Answer: A
Case Study 3
Case Study Questions
Overview. General Overview
Northwind Traders is a specialty food import company.
The company recently implemented Power BI to better understand its top customers, products, and suppliers.
Overview. Business Issues
The sales department relies on the IT department to generate reports in Microsoft SQL Server Reporting Services (SSRS). The IT department takes too long to generate the reports and often misunderstands the report requirements.
Existing Environment. Data Sources
Northwind Traders uses the data sources shown in the following table.
Source2 is exported daily from a third-party system and stored in Microsoft SharePoint Online.
Existing Environment. Customer Worksheet
Source2 contains a single worksheet named Customer Details. The first 11 rows of the worksheet are shown in the following table.
All the fields in Source2 are mandatory.
The Address column in Customer Details is the billing address, which can differ from the shipping address.
The Order Details table contains the following columns.
The address in the Orders table is the shipping address, which can differ from the billing address.
The Products table contains the following columns.
The Categories table contains the following columns.
The Suppliers table contains the following columns.
The Sales Employees table contains the following columns.
Each employee in the Sales Employees table is assigned to one sales region. Multiple employees can be assigned to each region.
Requirements. Report Requirements
Northwind Traders requires the following reports:
1. Top Products 2. Top Customers 3. On-Time Shipping
The Top Customers report will show the top 20 customers based on the highest sales amounts in a selected order month or quarter, product category, and sales region.
The Top Products report will show the top 20 products based on the highest sales amounts sold in a selected order month or quarter, sales region, and product category. The report must also show which suppliers provide the top products.
The On-Time Shipping report will show the following metrics for a selected shipping month or quarter:
1. The percentage of orders that were shipped late by country and shipping region 2. Customers that had multiple late shipments during the last quarter
Northwind Traders defines late orders as those shipped after the required shipping date.
The warehouse shipping department must be notified if the percentage of late orders within the current month exceeds 5%.
The reports must show historical data for the current calendar year and the last three calendar years.
Requirements. Technical Requirements
Northwind Traders identifies the following technical requirements:
1. A single dataset must support all three reports. 2. The reports must be stored in a single Power BI workspace. 3. Report data must be current as of 7 AM Pacific Time each day. 4. The reports must provide fast response times when users interact with a visualization. 5. The data model must minimize the size of the dataset as much as possible, while meeting the report requirements and the technical requirements.
Requirements. Security Requirements
Access to the reports must be granted to Azure Active Directory (Azure AD) security groups only. An Azure AD security group exists for each department.
The sales department must be able to perform the following tasks in Power BI:
1. Create, edit, and delete content in the reports. 2. Manage permissions for workspaces, datasets, and report. 3. Publish, unpublish, update, and change the permissions for an app. 4. Assign Azure AD groups role-based access to the reports workspace.
Users in the sales department must be able to access only the data of the sales region to which they are assigned in the Sales Employees table.
Power BI has the following row-level security (RLS) Table filter DAX expression for the Sales Employees table.
[EmailAddress] = USERNAME()
RLS will be applied only to the sales department users. Users in all other departments must be able to view all the data.
QUESTION 44
You need to configure access for the sales department users.
The solution must me meet the security requirements.
What should you do?
A.
Add the sales department as a member of the reports workspace
B.
Add the Azure Active Directory group of the sales department as an Admin of the reports workspace.
C.
Distribute an app to the users in the Azure Active Directory group of the sales department.
D.
Share each report to the Azure Active Directory group of the sales department.
Correct Answer: C
QUESTION 45
You have a Power BI semantic model named Model1 that runs in Import storage mode.
You need to reduce the size of Model1. The solution must NOT increase report query response times.
What should you do?
A.
Remove unnecessary columns.
B.
Unpivot unnecessary columns.
C.
Rename unnecessary columns.
D.
Change Model1 to DirectQuery storage mode.
Correct Answer: A
QUESTION 46
HOTSPOT
You have a Fabric workspace that contains the items shown in the following table.
You need to make content available to the management department and the accounting department at your company.
The solution must meet the following requirements:
1. The management department must have view access to the Headcount and Department Expenses reports. 2. The management department must NOT be able to view any other current or future reports. 3. The management department must NOT be able to build new reports by using the semantic models. 4. The accounting department must only be able to view the Company Expenses report. 5. The accounting department must be able to build new reports by using the Expenses semantic model.
The solution must follow the principle of least privilege and minimize administrative effort.
How should you make the content available to the users in each department? To answer, select the appropriate options in the answer area.
NOTE: Each collect selection is worth one point.
Correct Answer:
QUESTION 47
HOTSPOT
You have a Power BI semantic model named ModelA that contains the following columns:
All of the columns use the Text data type.
Based on the model, you create a report named ReportA that contains the following columns: 1. OrderID 2. OrderDate 3. CustomerID 4. ShippingAddress
ReportA is the only report connected to ModelA. You discover that ReportA has performance issues caused by the size of ModelA.
What should you do to optimize and reduce the size of ModelA? To answer, select the appropriate options in the answer area.
NOTE: Each correct selection is worth one point.
Correct Answer:
QUESTION 48
HOTSPOT
You have a report in Power BI Desktop.
You add a key influencers visual as shown in the exhibit. (Click the Exhibit tab.)
Use the drop-down menus to select the answer choice that completes each statement based on the information presented in the graphic.
NOTE: Each correct selection is worth one point.
Correct Answer:
QUESTION 49
Your company has training videos that are published to Microsoft Stream. You need to surface the videos directly in a Microsoft Power BI dashboard.
Contoso, Ltd. is a manufacturing company that produces outdoor equipment. Contoso has quarterly board meetings for which financial analysts manually prepare Microsoft Excel reports, including profit and loss statements for each of the company's four business units, a company balance sheet, and net income projections for the next quarter.
Existing Environment
Data and Sources
Data for the reports comes from three sources. Detailed revenue, cost, and expense data comes from an Azure SQL database. Summary balance sheet data comes from Microsoft Dynamics 365 Business Central. The balance sheet data is not related to the profit and loss results, other than they both relate dates.
Monthly revenue and expense projections for the next quarter come from a Microsoft SharePoint Online list. Quarterly projections relate to the profit and loss results by using the following shared dimensions: date, business unit, department, and product category.
Net Income Projection Data
Net income projection data is stored in a SharePoint Online list named Projections in the format shown in the following table.
Revenue projections are set at the monthly level and summed to show projections for the quarter.
Balance Sheet Data
The balance sheet data is imported with final balances for each account per month in the format shown in the following table.
There is always a row for each account for each month in the balance sheet data.
Dynamics 365 Business Central Data
Business Central contains a product catalog that shows how products roll up to product categories, which roll up to business units.
Revenue data is provided at the date and product level. Expense data is provided at the date and department level.
Business Issues
Historically, it has taken two analysts a week to prepare the reports for the quarterly board meetings. Also, there is usually at least one issue each quarter where a value in a report is wrong because of a bad cell reference in an Excel formula. On occasion, there are conflicting results in the reports because the products and departments that roll up to each business unit are not defined consistently.
Requirements
Planned Changes
Contoso plans to automate and standardize the quarterly reporting process by using Microsoft Power BI. The company wants to how long it takes to populate reports to less than two days. The company wants to create common logic for business units, products, and departments to be used across all reports, including, but not limited, to the quarterly reporting for the board.
Technical Requirements
Contoso wants the reports and datasets refreshed with minimal manual effort.
The company wants to provide a single package of reports to the board that contains custom navigation and links to supplementary information.
Maintenance, including manually updating data and access, must be minimized as much as possible.
Security Requirements
The reports must be made available to the board from powerbi.com. An Azure Active Directory group will be used to share information with the board.
The analysts responsible for each business unit must see all the data the board sees, except the profit and loss data, which must be restricted to only their business unit's data. The analysts must be able to build new reports from the dataset that contains the profit and loss data, but any reports that the analysts build must not be included in the quarterly reports for the board. The analysts must not be able to share the quarterly reports with anyone.
Report Requirements
You plan to relate the balance sheet to a standard date table in Power BI in a many-to-one relationship based on the last day of the month. At least one of the balance sheet reports in the quarterly reporting package must show the ending balances for the quarter, as well as for the previous quarter.
Projections must contain a column named RevenueProjection that contains the revenue projection amounts. A relationship must be created from Projections to a table named Date that contains the columns shown in the following table.
The definitions and attributes of products, departments, and business units must be consistent across all reports.
The board must be able to get the following information from the quarterly reports:
1. Revenue trends over time 2. Ending balances for each account 3. A comparison of expenses versus projections by quarter 4. Changes in long-term liabilities from the previous quarter 5. A comparison of quarterly revenue versus the same quarter during the prior year
QUESTION 50
HOTSPOT
You need to create a measure that returns the percent of revenue by product category.
How should you complete the measure? To answer, select the appropriate options in the answer area.
NOTE: Each correct selection is worth one point.
Correct Answer:
QUESTION 51
HOTSPOT
You are creating an analytics report that will consume data from the tables shown in the following table.
There is a relationship between the tables.
There are no reporting requirements on employee_id and employee_photo.
You need to optimize the data model.
What should you configure for employee_id and employee_photo? To answer, select the appropriate options in the answer area.
NOTE: Each correct selection is worth one point.
Correct Answer:
Explanation
Explanation/Reference:
Box 1: Hide Optimize data by hiding fields and sorting visualization data
Box 2: Delete The fastest way to optimize your Power BI report is to limit the number of columns to only the ones you need in your data model. Go through your tables in Power Query and determine what fields are being used. Delete these columns if they are not being used in any of your reports or calculations.
You plan to create the chart shown in the following exhibit.
How should you create the dashed horizontal line denoting the 40th percentile of daily sales for the period shown?
A.
Create a horizontal line that has a fixed value of 24,000.
B.
Add a measure to the visual that uses the following DAX expression. Measure1 = PERCENTILEX.EXC (Sales,sales[Total Sales],0.40)
C.
Add a new percentile line that uses Total Sales as the measure and 40% as the percentile.
D.
Add a measure to the visual that uses the following DAX expression. Measure1 = PERCENTILEX.INC (Sales,sales[Total Sales],0.40)
Correct Answer: C
Explanation
Explanation/Reference:
The analytics feature enables you to show percentiles across groups specified along a specific axis.
Example: 1. Click on the analytics tab 2. Select Percentile 3. You can choose a specific percentile along with other formatting options. 4. Drag a date or non-numeric dimension into the Axis of a column chart
Add percentile lines to monitor daily revenue
QUESTION 53
HOTSPOT
You have a column named UnitsInStock as shown in the following exhibit.
UnitsInStock has 75 non-null values, of which 51 are unique.
Use the drop-down menus to select the answer choice that completes each statement based on the information presented in the graphic.
NOTE: Each correct selection is worth one point.
Correct Answer:
Explanation
Explanation/Reference:
Box 1: 75
Box 2: reduce They reduce from the number of values (75), to the number of unique values (51).
You have a Power Bl semantic model named Model! that contains two fields named Sales and Quarter. Model 1 contains a DAX measure that sums the Sales column.
You need to create a report that will contain the visual shown in the following exhibit.
The solution must NOT require additional DAX measures.
Which type of visual should you use?
A.
ribbon chart
B.
line chart
C.
100% stacked area chart
D.
area chart
Correct Answer: D
QUESTION 55
HOTSPOT
You have a semantic model that has the relationships shown in the following exhibit.
Use the drop-down menus to select the answer choice that completes each statement based on the information presented in the graphic.
NOTE: Each correct selection is worth one point.
Correct Answer:
QUESTION 56
You are creating a dashboard by using the Power Bl service.
You have an existing report page that contains three charts.
You need to add the charts to the dashboard while maintaining the interactivity between the charts.
What should you do?
A.
Pin each chart as a tile.
B.
Edit interactions in the report and set all interactions to Filter
C.
Edit the dashboard theme and pin each chart as a file.
D.
Pin the report page as a live tile.
Correct Answer: D
QUESTION 57
You have a Power BI report that contains a card. The card displays the value for year-to-date revenue.
You need to ensure that screen reader users can read the value when initially interacting with the card. The value must stay updated as the dataset is refreshed.
What should you do?
A.
Convert the card into a text box.
B.
Add the value to the chart title text.
C.
Populate the alt text with a static value.
D.
Populate the alt text by using conditional formatting with a DAX measure.
Correct Answer: D
QUESTION 58
Note: This question is part of a series of questions that present the same scenario. Each question in the series contains a unique solution that might meet the stated goals. Some question sets might have more than one correct solution, while others might not have a correct solution.
After you answer a question in this section, you will NOT be able to return to it. As a result, these questions will not appear in the review screen.
You are modeling data by using Microsoft Power BI. Part of the data model is a large Microsoft SQL Server table named Order that has more than 100 million records. During the development process, you need to import a sample of the data from the Order table.
Solution: You add a WHERE clause to the SQL statement.
Does this meet the goal?
A.
Yes
B.
No
Correct Answer: A
Explanation
Explanation/Reference:
The WHERE clause has its effects before the data is imported.
You are creating a Microsoft Power Bl imported data model to perform basket analysis. The goal of the analysis is to identify which products are usually bought together in the same transaction across and within sales territories. You import a fact table named Sales as shown in the exhibit. (Click the Exhibit tab.)
The related dimension tables are imported into the model.
Sales contains the data shown in the following table.
Correct Answer:
QUESTION 60
HOTSPOT
You use Power Query Editor to review a query that contains a column named Country.
You need to view the following information in the Data preview view for the Country column: 1. The percentage of values that contain errors. 2. The count of empty values.
What should you enable? To answer, select the appropriate options in the answer area.
NOTE: Each correct selection is worth one point.
Correct Answer:
QUESTION 61
HOTSPOT
You have a Power BI semantic model that contains three tables named Products, OrderHistory, and Date. The Products table is a dimension table that contains the following columns: 1. ProductID 2. ProductName
The OrderHistory table is a fact table that contains the following columns: 1. OrderID 2. ProductID 3. OrderDate
The Date table is a dimension table that contains the following columns: 1. Year 2. Date 3. Week 4. Month
You need to define a relationship from Products to OrderHistory and from OrderHistory to Date.
Which cardinality should you configure? To answer, select the appropriate options in the answer area.
NOTE: Each correct answer is worth one point.
Correct Answer:
QUESTION 62
HOTSPOT
You use Power Query Editor to preview the data shown in the following exhibit.
You confirm that the data will always start on row 3, and row 3 will always contain the column names.
How should you shape the query? To answer, select the appropriate options in the answer area.
NOTE: Each correct selection is worth one point.
Correct Answer:
QUESTION 63
You have a Power Bl workspace named Inventory that contains a dataset a report and a dashboard. You need to add an additional tile to the dashboard. The tile must show inventory by location. This information is NOT visualized in the report. The solution must minimize the impact on the report. Which of following two actions should you perform? Each correct answer presents part of the solution. NOTE: Each correct selection is worth one point.
A.
Add the visual to the report.
B.
Ask a question by using Q&A.
C.
Pin the visual to the dashboard.
D.
Use quick insights on the dashboard.
Correct Answer: BC
QUESTION 64
HOTSPOT
You have a Fabric workspace that contains the items shown in the following table.
You need to make content available to the management department and the accounting department at your company. The solution must meet the following requirements: 1. The management department must have view access to the Headcount and Department Expenses reports. 2. The management department must NOT be able to view any other current or future reports. 3. The management department must NOT be able to build new reports by using the semantic models. 4. The accounting department must only be able to view the Company Expenses report. 5. The accounting department must be able to build new reports by using the Expenses semantic model.
The solution must follow the principle of least privilege and minimize administrative effort.
How should you make the content available to the users in each department? To answer, select the appropriate options in the answer area.
NOTE: Each collect selection is worth one point.
Correct Answer:
QUESTION 65
DRAG DROP
You have the Power Bl data model shown in the following exhibit.
You create two row-level security (RlS) roles named Manager and CFO.
You plan to publish the dataset to the Power Bl service.
You need to create DAX expressions for the RLS filters. The solution must meet the following requirements:
1. Each manager must see only the data in the Sales and Human Resources tables for their own country. 2. The CFO must be prevented from seeing the data in the Human Resources table. 3. The CFO must see the sales data of all countries.
How should you complete the DAX expressions to meet the requirements? To answer, drag the
appropriate expressions to the correct targets. Each expression may be used once, more than once, or not at all. You may need to drag the split bar between panes or scroll to view content.
NOTE: Each correct selection is worth one point.
The Country table contains the following data.
You plan to publish the dataset to the Power Bl service.
You need to create DAX expressions for the RLS filters. The solution must meet the following requirements:
1. Each manager must see only the data in the Sales and Human Resources tables for their own country. 2. The CFO must be prevented from seeing the data in the Human Resources table. 3. The CFO must see the sales data of all countries.
How should you complete the DAX expressions to meet the requirements? To answer, drag the appropriate expressions to the correct targets. Each expression may be used once, more than once, or not at all. You may need to drag the split bar between panes or scroll to view content.
NOTE: Each correct selection is worth one point.
Correct Answer:
QUESTION 66
HOTSPOT
You need to create a visualization to meet the reporting requirements of the sales managers.
How should create the Visualization? TO answer, select the appropriate options in the answer area.
Correct Answer:
QUESTION 67
DRAG DROP
You have a Microsoft Power BI data model that contains three tables named Sales, Product, and Date.
The Sales table has an existing measure named [Total Sales] that sums the total sales from the Sales table.
You need to write a calculation that returns the percentage of total sales that a selected ProductCategoryName value represents. The calculation must respect any slicers on ProductCategoryName and must show the percentage of visible total sales. For example, if there are four ProductCategoryName values, and a user filters one out, a table showing ProductCategoryName and the calculation must sum up to 100 percent.
How should you complete the calculation? To answer, drag the appropriate values to the correct targets. Each value may be used once, more than once, or not at all. You may need to drag the split bar between panes or scroll to view content.
NOTE: Each correct selection is worth one point.
Correct Answer:
Explanation
Explanation/Reference:
Box 1: DIVIDE
As a data modeler, when you write a DAX expression to divide a numerator by a denominator, you can choose to use the DIVIDE function or the divide operator (/ - forward slash). When using the DIVIDE function, you must pass in numerator and denominator expressions.
Box 2: CALCULATE CALCULATE rvaluates an expression in a modified filter context.
Box 3: ALLSELECTED ALLSELECTED removes context filters from columns and rows in the current query, while retaining all other context filters or explicit filters. The ALLSELECTED function gets the context that represents all rows and columns in the query, while keeping explicit filters and contexts other than row and column filters. This function can be used to obtain visual totals in queries.
You need to configure row-level security (RLS) to restrict data access for users that have the Viewer permissions.
Which three actions should you perform in sequence? To answer, move the appropriate actions from the list of actions to the answer area and arrange them in the correct order.
Correct Answer:
QUESTION 69
You need to create a Power BI theme that will be used in multiple reports. The theme will include corporate branding for font size, color, and bar chart formatting.
What should you do?
A.
From Power Bl Desktop, customize the current theme,
B.
From power Bl Desktop, use a built in report theme.
C.
Create a theme as a JSON file and import the theme into Power Bl Desktop.
D.
Create a theme as a PBIVlZ file and import the theme into Power Bl Desktop.
Correct Answer: C
QUESTION 70
You have the visual shown in the exhibit. (Click the Exhibit tab.)
You need to show the relationship between Total Cost and Total Sales over time.
What should you do?
A.
Add a play axis.
B.
Add a slicer for the year.
C.
From the Analytics pane, add an Average line.
D.
Create a DAX measure that calculates year-over-year growth.
Correct Answer: A
Explanation
Explanation/Reference:
When to use a slicer Slicers are a great choice when you want to: Display commonly used or important filters on the report canvas for easier access. Make it easier to see the current filtered state without having to open a drop-down list. Filter by columns that are unneeded and hidden in the data tables. Create more focused reports by putting slicers next to important visuals. Note: Suppose you want your report readers to be able to look at overall sales metrics, but also highlight performance for individual district managers and different time frames. You could create separate reports or comparative charts. You could add filters in the Filters pane. Or you could use slicers. Slicers are another way of filtering. They narrow the portion of the dataset that is shown in the other report visualizations.
You have a PBiX file that imports several tables from an Azure SQL database.
The data will be migrated to another Azure SQL database.
You need to change the connections in the PBIX file. The solution must minimize administrative effort.
What should you do?
A.
From Power Query Editor, modify the source of each query.
B.
Create a PBiT file, open the file, and change the data sources when prompted
C.
From Power Query Editor, create new queries.
D.
Modify the Data source settings.
Correct Answer: D
QUESTION 72
You build a report to help the sales team understand its performance and the drivers of sales. The team needs to have a single visualization to identify which factors affect success.
Which type of visualization should you use?
A.
Key influences
B.
Funnel chart
C.
Q&A
D.
Line and clustered column chart
Correct Answer: A
Explanation
Explanation/Reference:
The key influencers visual helps you understand the factors that drive a metric you're interested in. It analyzes your data, ranks the factors that matter, and displays them as key influencers.
The key influencers visual is a great choice if you want to: See which factors affect the metric being analyzed. Contrast the relative importance of these factors. For example, do short-term contracts have more impact on churn than long-term contracts?
You create a Power Bl dataset that contains the table shown in the following exhibit.
You need to make the table available as an organizational data type In Microsoft Excel.
How should you configure the properties of the table? To answer select the appropriate options in the answer area.
NOTE: Each correct selection is worth one point.
Correct Answer:
QUESTION 74
DRAG DROP
You build a report about warehouse inventory data. The dataset has more than 10 million product records from 200 warehouses worldwide.
You have a table named Products that contains the columns shown in the following table.
Warehouse managers report that it is difficult to use the report because the report uses only the product name in tables and visuals. The product name is contained within the ProductDescription column and is always the fourth value.
You need to modify the report to support the warehouse managers requirement to explore inventory levels at different levels of the product hierarchy. The solution must minimize the model size.
Which three actions should you perform in sequence? To answer, move the appropriate actions from the list of actions to the answer area and arrange them in the correct order.
Correct Answer:
Explanation
Explanation/Reference:
Power BI Desktop supports the use of inline hierarchy labels. With inline hierarchy labels, you can see hierarchy labels as you expand visuals using the Expand All feature.
You have a data model that contains many complex DAX expressions. The expressions contain frequent references to the RELATED and RELATEDTABLE functions.
You need to recommend a solution to minimize the use of the RELATED and RELATEDTABLE functions.
What should you recommend?
A.
Merge tables by using Power Query.
B.
Hide unused columns in the model.
C.
Split the model into multiple models.
D.
Transpose.
Correct Answer: A
Explanation
Explanation/Reference:
Combining data means connecting to two or more data sources, shaping them as needed, then consolidating them into a useful query. When you have one or more columns that you'd like to add to another query, you merge the queries.
Note: The RELATEDTABLE function is a shortcut for CALCULATETABLE function with no logical expression. CALCULATETABLE evaluates a table expression in a modified filter context and returns A table of values.
Note: This question is part of a series of questions that present the same scenario. Each question in the series contains a unique solution that might meet the stated goals. Some question sets might have more than one correct solution, while others might not have a correct solution.
After you answer a question in this section, you will NOT be able to return to it. As a result, these questions will not appear in the review screen.
You are modeling data by using Microsoft Power BI. Part of the data model is a large Microsoft SQL Server table named Order that has more than 100 million records.
During the development process, you need to import a sample of the data from the Order table.
Solution: From Power Query Editor, you import the table and then add a filter step to the query.
Does this meet the goal?
A.
Yes
B.
No
Correct Answer: B
QUESTION 77
Note: This question is part of a series of questions that present the same scenario. Each question in the series contains a unique solution that might meet the stated goals. Some question sets might have more than one correct solution, while others might not have a correct solution.
After you answer a question in this section, you will NOT be able to return to it. As a result, these questions will not appear in the review screen.
From Power Query Editor, you profile the data shown in the following exhibit.
The IoT GUID and IoT ID columns are unique to each row in query.
You need to analyze IoT events by the hour and day of the year. The solution must improve dataset performance.
Solution: You remove the loT GUID column and retain the loT ID column.
Does this meet the goal?
A.
Yes
B.
No
Correct Answer: A
QUESTION 78
HOTSPOT
You have a Power BI report that contains the table visual shown in the following exhibit.
You need to modify the visual to display as shown in the following exhibit.
How should you configure the visual? To answer, select the appropriate options in the answer area.
NOTE: Each correct selection is worth one point.
Correct Answer:
QUESTION 79
You plan to use Power B1 to create sales invoices for customers. The solution must meet the following requirements:
1. Sales invoices must be exported in a PDF format 2. The PDF exports must show all columns and rows clearly.
What should you create?
A.
a paginated report that contains a table
B.
an interactive report that contains a matrix
C.
a dashboard that contains a table
D.
an inlet active report that contains a table
Correct Answer: A
QUESTION 80
In Power BI Desktop, you are building a sales report that contains two tables. Both tables have row-level security (RLS) configured.
You need to create a relationship between the tables. The solution must ensure that bidirectional cross-filtering honors the RLS settings.
What should you do?
A.
Create an active relationship between the tables and select Assume referential integrity.
B.
Create an inactive relationship between the tables and select Assume referential integrity.
C.
Create an inactive relationship between the tables and select Apply security filter in both directions.
D.
Create an active relationship between the tables and select Apply security filter in both directions.
Correct Answer: D
Explanation
Explanation/Reference:
By default, row-level security filtering uses single-directional filters, whether the relationships are set to single direction or bi-directional. You can manually enable bi-directional cross-filtering with row-level security by selecting the relationship and checking the Apply security filter in both directions checkbox.
Select this option when you've also implemented dynamic row-level security at the server level, where row-level security is based on username or login ID.
You have a Power BI report that contains the visual shown in the following exhibit.
You plan to modify the visual by changing the column spacing and adding percent change labels as shown in the following exhibit.
What should you do? To answer, select the appropriate options in the answer area.
NOTE: Each correct selection is worth one point.
Correct Answer:
QUESTION 82
DRAG DROP
You plan to create a report that will display sales data from the last year for multiple regions
You need to restrict access to individual rows of the data on a per region-basis by using roles.
Which four actions should you perform in sequence?
To answer, move the appropriate actions from the list of actions to the answer area and arrange them in the correct order.
Correct Answer:
Explanation
Explanation/Reference:
You can define roles and rules within Power BI Desktop. When you publish to Power BI, it also publishes the role definitions. To define security roles, follow these steps. 1. Import data into your Power BI Desktop report (Step 1) 2. From the Modeling tab, select Manage Roles. 3. From the Manage roles window, select Create. (Step 2) 4. Under Roles, provide a name for the role. 5. Under Tables, select the table to which you want to apply a DAX rule. 6. In the Table filter DAX expression box, enter the DAX expressions. This expression returns a value of true or false. For example: [Entity ID] = ג€Valueג€(Step 3) 7. After you've created the DAX expression, select the checkmark above the expression box to validate the expression. 8. Select Save. Step 3: Assign Users to the role. You can't assign users to a role within Power BI Desktop. You assign them in the Power BI service. After you've created your roles, test the results of the roles within Power BI Desktop. Step 4: Publish the report. Now that you're done validating the roles in Power BI Desktop, go ahead and publish your report to the Power BI service.