Exam Details
Exam Code
:E20-007Exam Name
:Data Science and Big Data AnalyticsCertification
:EMC CertificationsVendor
:EMCTotal Questions
:198 Q&AsLast Updated
:Jul 02, 2025
EMC EMC Certifications E20-007 Questions & Answers
-
Question 1:
Refer to the exhibit.
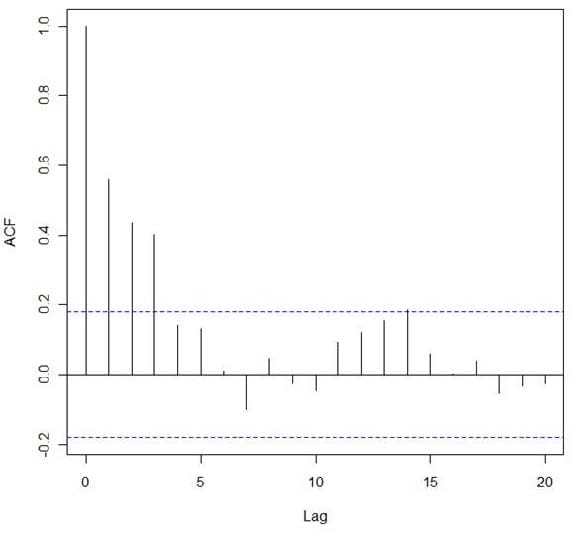
In the exhibit, a correlogram is provided based on an autocorrelation analysis of a sample dataset. What can you conclude from only this exhibit?
A. There is significant autocorrelation through lag 3
B. There is no structure left to model in the data
C. Lag 7 has a significant negative autocorrelation
D. Differencing is required before proceeding with any analysis
-
Question 2:
Which word or phrase completes the statement? A data warehouse is to a centralized database for reporting as an analytic sandbox is to a _______?
A. Collection of data assets for modeling
B. Collection of low-volume databases
C. Centralized database of KPIs
D. Collection of data assets for ETL
-
Question 3:
Refer to the exhibit.
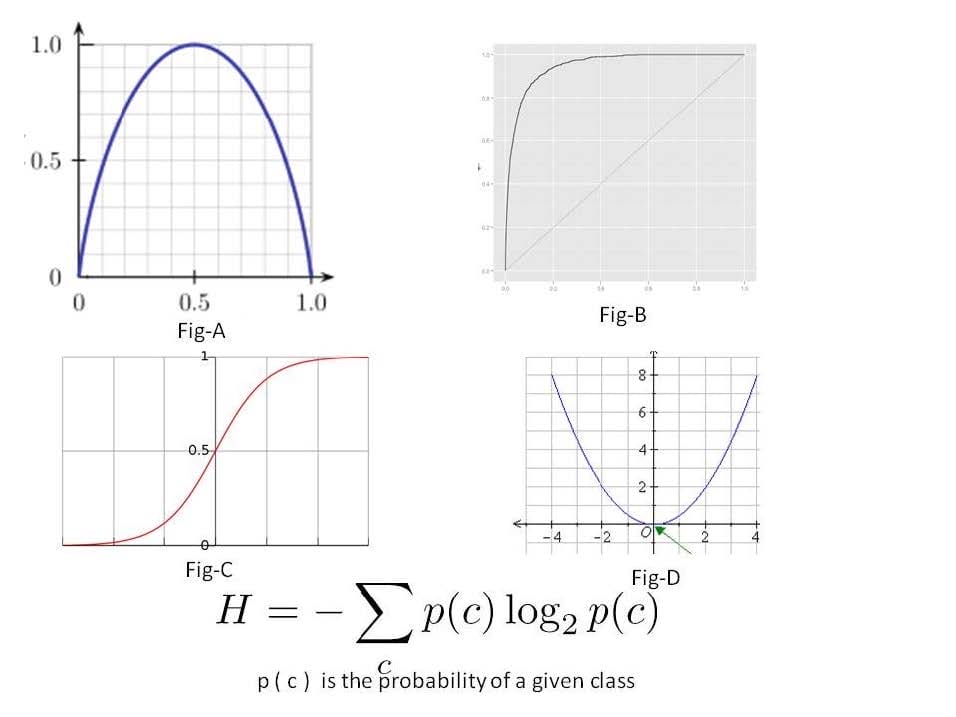
The exhibit shows four graphs labeled as Fig A thorough Fig D. Which figure represents the entropy function relative to a Boolean classification and is represented by the formula shown in Exhibit?
A. Fig-A
B. Fig-B
C. Fig-C
D. Fig-D
-
Question 4:
Refer to the exhibit.

You are asked to write a report on how specific variables impact your client's sales using a data set provided to you by the client. The data includes 15 variables that the client views as directly related to sales, and you are restricted to these variables only.
After a preliminary analysis of the data, the following findings were made:
1.
Multicollinearity is not an issue among the variables
2.
Only three variables--A, B, and C--have significant correlation with sales
You build a linear regression model on the dependent variable of sales with the independent variables of
A, B, and C. The results of the regression are seen in the exhibit.
Which interpretation is supported by the analysis?
A. Variables A, B, and C are significantly impacting sales, but are not effectively estimating sales
B. Variables A, B, and C are significantly impacting sales and are effectively estimating sales
C. Due to the R2 of 0.10, the model is not valid ?the linear regression should be re-run with all 15 variables forced into the model to increase the R2
D. Due to the R2 of 0.10, the model is not valid ?a different analytical model should be attempted
-
Question 5:
What is holdout data?
A. a subset of the provided data set selected at random and used to validate the model
B. a subset of the provided data set selected at random and used to initially construct the model
C. a subset of the provided data set that is removed by the data scientist because it contains data errors
D. a subset of the provided data set that is removed by the data scientist because it contains outliers
-
Question 6:
Under which circumstance do you need to implement N-fold cross-validation after creating a regression model?
A. There is not enough data to create a test set.
B. The data is unformatted.
C. There are missing values in the data.
D. There are categorical variables in the model.
-
Question 7:
Consider the following itemsets: (hat, scarf, coat)
(hat, scarf, coat, gloves)
(hat, scarf, gloves)
(hat, gloves)
(scarf, coat, gloves)
What is the confidence of the rule (hat, scarf) => gloves?
A. 40%
B. 50%
C. 60%
D. 66%
-
Question 8:
In which lifecycle stage are appropriate analytical techniques determined?
A. Model planning
B. Model building
C. Data preparation
D. Discovery
-
Question 9:
You are analyzing data in order to build a classifier model. You discover non-linear data and discontinuities that will affect the model. Which analytical method would you recommend?
A. Decision Trees
B. Logistic Regression
C. ARIMA
D. Linear Regression
-
Question 10:
You are performing a marketing analysis on baskets using the Apriori algorithm. Which measure is a ratio that describes how many more times two items are present together than would be expected if those two items are statistically independent?
A. Lift
B. Leverage
C. Support
D. Confidence
Related Exams:
D-GAI-F-01
Dell GenAI Foundations AchievementD-MSS-DS-23
Dell Midrange Storage Solutions Design 2023D-OME-OE-A-24
Dell OpenManage Operate AchievementD-PDD-DY-23
Dell PowerProtect DD Deploy 2023D-PE-OE-23
Dell PowerEdge Operate 2023D-PEXE-IN-A-00
Dell PowerEdge XE9680 and XE8640 InstallD-PSC-MN-01
Dell GenAI Foundations AchievementD-PST-MN-A-24
Dell PowerStore Maintenance AchievementD-PWF-DS-23
Dell PowerFlex Design 2023D-RP-DY-A-24
Dell RecoverPoint Deploy Achievement
Tips on How to Prepare for the Exams
Nowadays, the certification exams become more and more important and required by more and more enterprises when applying for a job. But how to prepare for the exam effectively? How to prepare for the exam in a short time with less efforts? How to get a ideal result and how to find the most reliable resources? Here on Vcedump.com, you will find all the answers. Vcedump.com provide not only EMC exam questions, answers and explanations but also complete assistance on your exam preparation and certification application. If you are confused on your E20-007 exam preparations and EMC certification application, do not hesitate to visit our Vcedump.com to find your solutions here.