An analyst is reviewing the following data: Car IDSpeed 123155 566436 564418 650567 546436 645638 Which of the following should the analyst include in the measures of central tendency for speed?
-
A
Mode = 38 Range = 31 Mean = 42.5
-
B
Range = 49 Max = 67 Min = 18
-
C
Mode = 36 Max = 67 Min = 18
-
D
Mode = 36 Median = 37 Mean = 41.5
Reveal answer details
Close answer details
Correct answerD
ExplanationThe measures of central tendency include the mode, median, and mean. The mode is the value that appears most frequently in a data set. In this case, the speed of 36 appears twice, making it the mode. The median is the middle value when a data set is ordered from least to greatest; for these speeds, when
ordered (18, 36, 36, 38, 55, 67), the median is the average of the two middle numbers, which is ( \frac{36 + 38}{2} = 37 ). The mean is the average of all values, calculated as ( \frac{55 + 36 + 18 + 67 + 36 + 38}{6} =
41.7 ). References:
The calculation of the mode, median, and mean is based on standard statistical formulas and definitions.
The measures of central tendency for speed include the mode, median, and mean. To calculate these, we
first need to organize the data: Speeds in ascending order: 18, 36, 36, 38, 55, 67
Mode is the value that appears most frequently, which is 36, as it appears twice. Median is the middle value when the data is ordered. Since we have an even number of observations, we take the average of the two middle values (36 and
38), resulting in 37.
Mean is the sum of all values divided by the number of values. (18+36+36+38+55+67)/6=41.5(18+36+36
+38+55+67)/6=41.5. Thus, the correct option is D, which includes Mode = 36, Median = 37, and Mean = 41.5. The range, maximum, and minimum values, although useful in understanding data dispersion, are not measures of central tendency and are therefore not relevant to this specific question.
A data analyst was asked to create a chart that shows the relationship between study hours and exam scores for each student using the data sets in the table below: 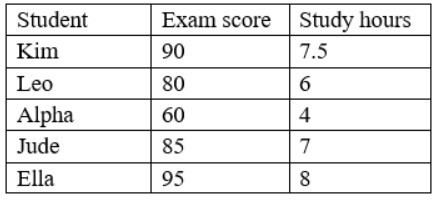 Which of the following charts would BEST represent the relationship between the variables?
-
A
-
B
-
C
-
D
Reveal answer details
Close answer details
Correct answerB
ExplanationThis is because a scatter plot is a type of chart that shows the relationship between two variables for each observation or unit in a data set, such as study hours and exam scores for each student in this case. A scatter plot can be used to display and analyze the correlation, trend, or pattern among the variables, as well as identify any outliers or clusters in the data. For example, a scatter plot can show if there is a positive, negative, or no correlation between study hours and exam scores, as well as show if there are any students who have unusually high or low exam scores compared to their study hours. The other charts are not the best charts to represent the relationship between the variables. Here is why: A histogram is a type of chart that shows the frequency or the count of values in a single variable for different intervals or bins, such as exam scores for different ranges in this case. A histogram can be used to display and analyze the distribution, shape, or spread of the variable, as well as identify any gaps, peaks, or skewness in the data. For example, a histogram can show if most students have high, low, or average exam scores, as well as show if there are any intervals that have no students at all.
A heat map is a type of chart that shows the intensity or the magnitude of values in two variables for different categories or groups, such as exam scores and study hours for different student names in this case. A heat map can be used to display and analyze the variation, contrast, or comparison among the categories or groups, as well as identify any hot spots, cold spots, or gradients in the data. For example, a heat map can show which students have higher or lower exam scores and study hours than others, as well as show if there is a color pattern that indicates a relationship between exam scores and study hours. A bar chart is a type of chart that shows the value or the amount of a single variable for different categories or groups, such as exam scores for different student names in this case. A bar chart can be used to display and analyze the comparison, ranking, or proportion among the categories or groups, as well as identify any differences, similarities, or outliers in the data. For example, a bar chart can show which students have higher or lower exam scores than others, as well as show if there are any students who have exceptionally high or low exam scores.
Which one of the following is a measure of dispersion?
-
A
-
B
-
C
-
D
Reveal answer details
Close answer details
Question 4
Lab simulation
Simulation The director of operations at a power company needs data to help identify where company resources should be allocated in order to monitor activity for outages and restoration of power in the entire state.
Specifically, the director wants to see the following: 1. County outages
2. Status
3. Overall trend of outages INSTRUCTIONS: Please, select each visualization to fit the appropriate space on the dashboard and choose an appropriate color scheme. Once you have selected all visualizations, please, select the appropriate titles and labels, if applicable. Titles and labels may be used more than once. If at any time you would like to bring back the initial state of the simulation, please click the Reset All button. 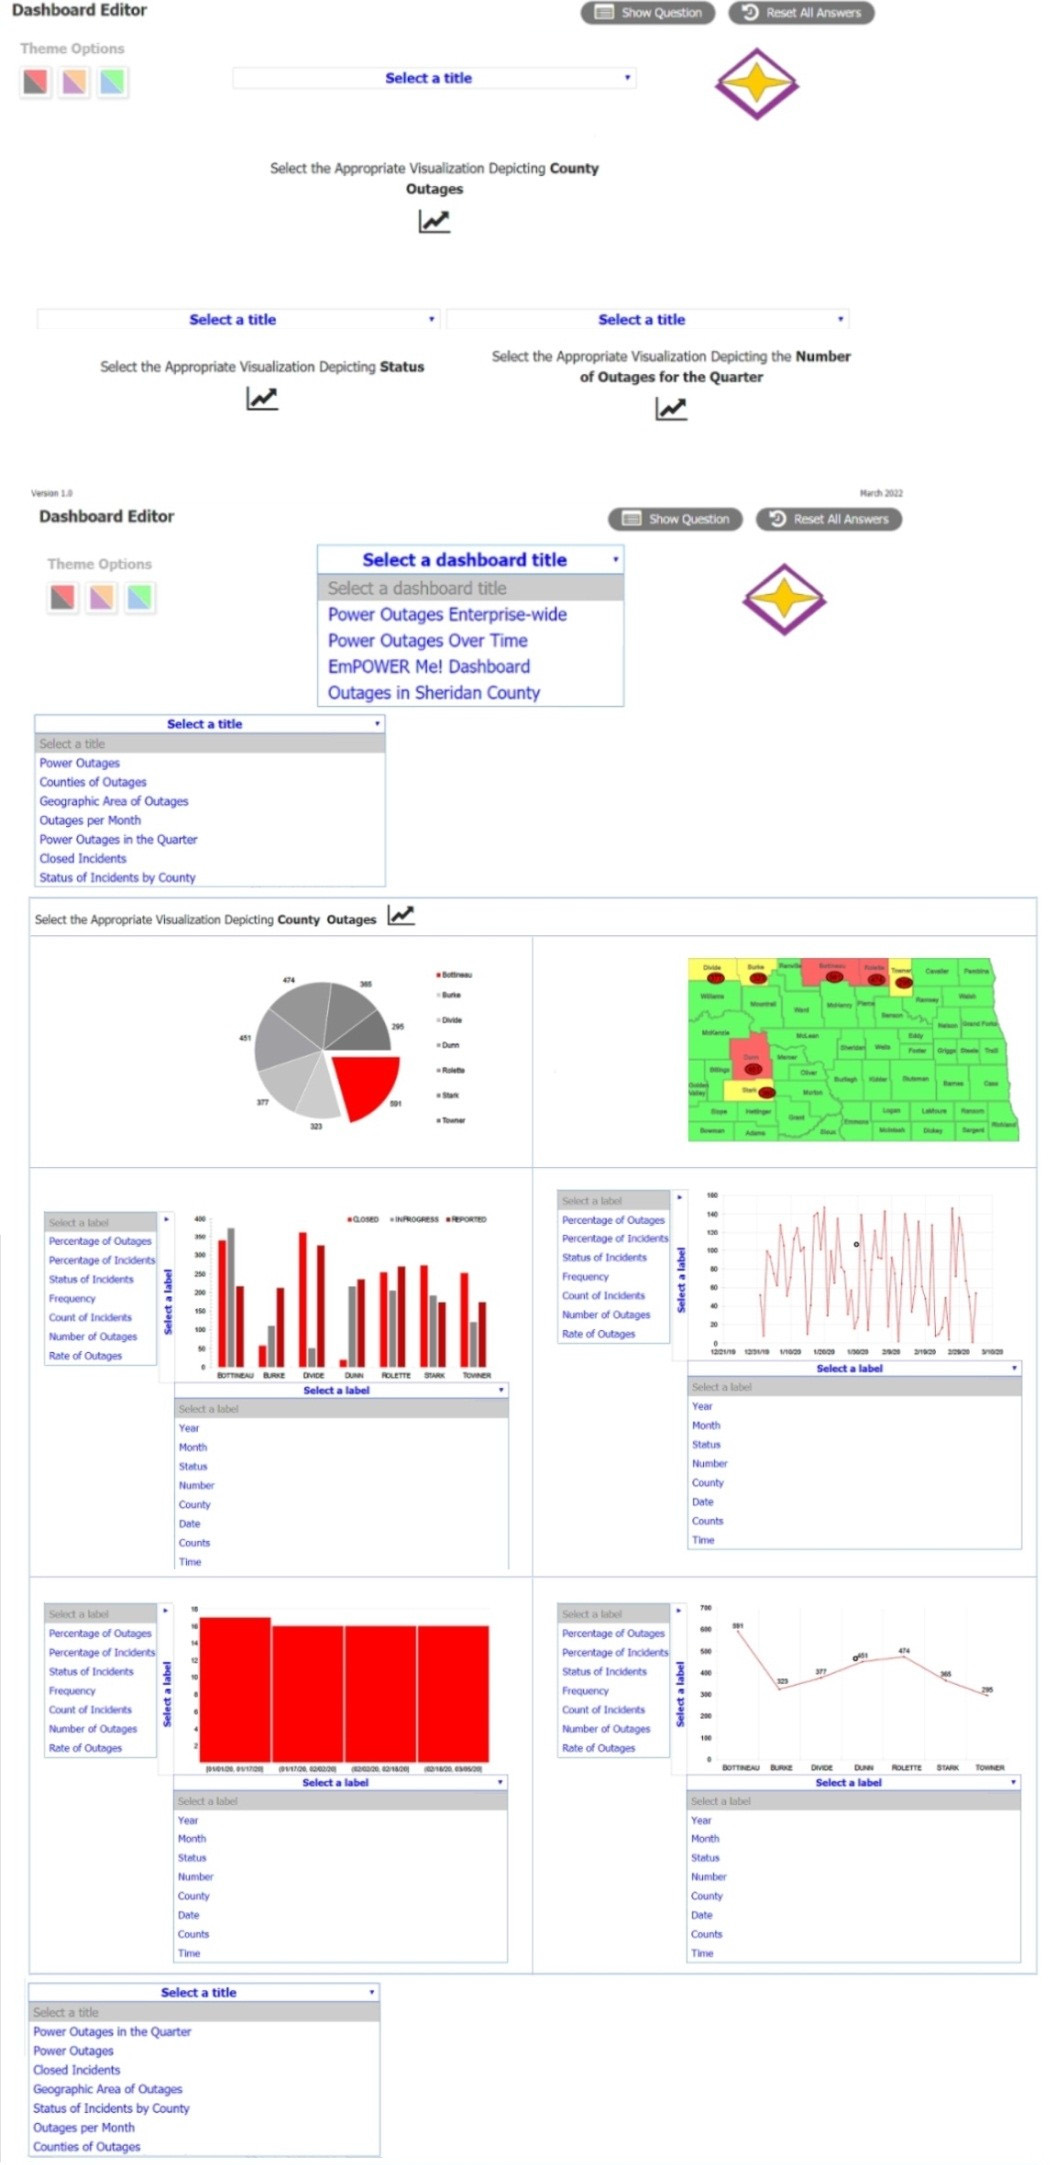
Reveal model answer
Close model answer
Power outages
This is a simulation question that requires you to create a dashboard with visualizations that meet the director's needs. Here are the steps to complete the task: Drag and drop the visualization that shows the county outages on the top left space of the dashboard. This visualization is a map of the state with different colors indicating the number of outages in each county.
You can choose any color scheme that suits your preference, but make sure that the colors are consistent and clear. For example, you can use a gradient of red to show the counties with more outages and green to show the counties with less outages. Drag and drop the visualization that shows the status of the outages on the top right space of the dashboard. This visualization is a pie chart that shows the percentage of outages that are active, restored, or pending. You can choose any color scheme that suits your preference, but make sure that the colors are distinct and easy to identify. For example, you can use red for active, green for restored, and yellow for pending.
Drag and drop the visualization that shows the overall trend of outages on the bottom space of the dashboard. This visualization is a line graph that shows the number of outages over time. You can choose any color scheme that suits your preference, but make sure that the color is visible and contrasted with the background. For example, you can use blue for the line and white for the background.
Select appropriate titles and labels for each visualization. Titles and labels may be used more than once.
For example, you can use "County Outages" as the title for the map, "Status" as the title for the pie chart, and "Trend" as the title for the line graph. You can also use "County", "Number of Outages", "Active", "Restored", "Pending", "Time", and "Number of Outages" as labels for the axes and legends of the visualizations.
A stakeholder wants to see daily sales targets organized in a dashboard by country, state, city, and ZIP Code. Which of the following delivery considerations must a data analyst take into account when creating the dashboard?
-
A
-
B
-
C
-
D
Reveal answer details
Close answer details
Which of the following query optimization techniques involves examining only the data that is needed for a particular task?
-
A
-
B
-
C
-
D
Creating an execution plan
Reveal answer details
Close answer details
Correct answerC
ExplanationThe correct answer is C. Indexing documents. Indexing documents is a query optimization technique that involves creating a data structure that allows faster access to the data in the documents. Indexing documents can reduce the amount of data that needs to be scanned for a particular query, thus improving the performance and efficiency of the query. Indexing documents can also help with searching, sorting, filtering, and aggregating the data in the documents.
A data analyst is working for a shipping company and calculating the volume of boxes according to the following formula: volume = height ?width ?depth. Which of the following variable types describes volume?
-
A
-
B
-
C
-
D
Reveal answer details
Close answer details
A database administrator needs to ensure only approved users can access specific database tables to perform financial functions. Which of the following is the best access control method for the administrator to use?
-
A
-
B
-
C
-
D
Reveal answer details
Close answer details
A data analyst who works for a government agency is required to obtain the average income of citizens.
The list of citizens is given in the following table: 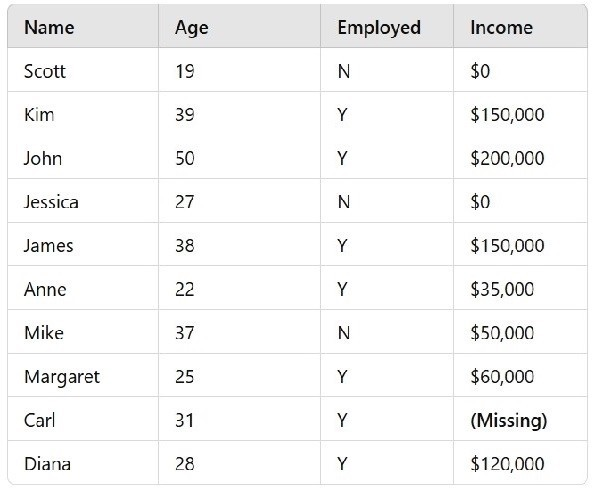 A value for one citizen's income is missing. Which of the following approaches should the data analyst take to solve this issue?
-
A
Replace the missing value with the average of the rest of the unemployed citizens.
-
B
Insert the value 0 into the field with the missing value.
-
C
Impute the mean of the other citizens' incomes into the field with the missing value.
-
D
Exclude employed citizens from the analysis.
Reveal answer details
Close answer details
Question 10
Single choice
A data analyst needs to collect a similar proportion of data from every state. Which of the following sampling methods would be the most appropriate?
-
A
-
B
-
C
-
D
Reveal answer details
Close answer details
Correct answerC
ExplanationThe best sampling method for the data analyst's need is C. Stratified sampling.
Stratified sampling is a type of probability sampling that involves dividing the population into homogeneous groups or strata based on some characteristic, such as state, and then randomly selecting a proportional number of individuals from each stratum. Stratified sampling ensures that every group is adequately represented in the sample, and reduces the sampling error and variability. Systematic sampling is not correct, because it involves selecting every nth individual from the population, starting from a random point.
Systematic sampling does not guarantee that every state will have a similar proportion of data in the sample, and may introduce bias or error if there is a hidden pattern or order in the population. Convenience sampling is not correct, because it involves selecting individuals who are easily accessible or available to the researcher. Convenience sampling is a type of non-probability sampling that does not involve random selection, and may result in a biased or unrepresentative sample. Random sampling is not correct, because it involves selecting individuals from the population at random, without any grouping or stratification. Random sampling may not produce a sample that has a similar proportion of data from every state, especially if the population is large or heterogeneous. Random sampling may also have a higher sampling error and variability than stratified sampling.
Question 11
Single choice
An analyst is working with the income data of suburban families in the United States. The data set has a lot of outliers, and the analyst needs to provide a measure that represents the typical income. Which of the following would BEST fulfill the analyst's goal?
-
A
-
B
-
C
-
D
Reveal answer details
Close answer details
Correct answerA
Explanationhis is because median is a type of statistical measure that represents the typical value or central tendency of a data set, which means that it divides the data set into two equal halves, such that half of the values are above it and half are below it. Median can be used to provide a measure that represents the typical income of suburban families in the United States, especially when the data set has a lot of outliers, which means that it has values that are unusually high or low compared to the rest of the data set. Median can provide a measure that represents the typical income of suburban families in the United States, because it is not affected or skewed by the outliers, as it only depends on the middle value or the middle two values of the data set, regardless of how extreme or distant the outliers are. For example, median can provide a measure that represents the typical income of suburban families in the United States, by finding the income value that splits the data set into two equal groups of families, such that 50% of the families have higher incomes and 50% have lower incomes. The other statistical measures are not the best measures to represent the typical income of suburban families in the United States. Here is why: Mean is a type of statistical measure that represents the average value or central tendency of a data set, which means that it is the sum of all the values divided by the number of values. Mean is not a good measure to represent the typical income of suburban families in the United States, especially when the data set has a lot of outliers, because it is affected or skewed by the outliers, as it takes into account all the values in the data set, regardless of how extreme or distant they are. For example, mean can provide a measure that does not represent the typical income of suburban families in the United States, by finding the income value that is influenced by a few very high or very low incomes, which could make it higher or lower than most of the incomes in the data set.
Mode is a type of statistical measure that represents the most frequent value or mode of a data set, which means that it is the value that occurs most often in the data set. Mode is not a good measure to represent the typical income of suburban families in the United States, especially when the data set has a lot of outliers, because it is not representative or indicative of the central tendency or distribution of the data set, as it only depends on the count or occurrence of a single value or a few values in the data set, regardless of how common or rare they are. For example, mode can provide a measure that does not represent the typical income of suburban families in the United States, by finding the income value that is repeated more often than others, which could be an outlier or an anomaly in the data set.
Standard deviation is a type of statistical measure that represents the amount of dispersion or variation of a data set, which means that it quantifies how much the values in a data set vary or deviate from the mean or average of the data set. Standard deviation is not a measure that represents the typical income of suburban families in the United States, but rather a measure that describes the spread or distribution of their incomes, as well as identifies any outliers or extreme values in their incomes. For example, standard deviation can provide a measure that describes how diverse or homogeneous their incomes are, as well as how far their incomes are from their average income.
Question 12
Single choice
Which of the following best describes a 95% confidence interval?
-
A
There is a 95% probability that a sample is within one standard deviation of the mean.
-
B
A stated range may contain 95% of the population mean, 95% of the time.
-
C
A set of ranges contains the population mean with 95% certainty.
-
D
A range contains 95% of the population mean.
Reveal answer details
Close answer details
Question 13
Single choice
Which of the following statements would be used to append two tables that have the same number of columns?
-
A
-
B
-
C
-
D
Reveal answer details
Close answer details
Correct answerA
ExplanationThe correct answer is A. UNION ALL.
UNION ALL is a SQL statement that appends two tables that have the same number of columns and compatible data types. UNION ALL preserves all the rows from both tables, including any duplicates.
Option B: MERGE is not correct, because MERGE is a SQL statement that combines the data of two tables based on a common column. MERGE can perform insert, update, or delete operations on the target table depending on the matching or non-matching rows from the source table.
Option C: GROUP BY is not correct, because GROUP BY is a SQL clause that groups the rows of a table based on one or more columns. GROUP BY is often used with aggregate functions, such as SUM, AVG, COUNT, etc., to calculate summary statistics for each group.
Option D: JOIN is not correct, because JOIN is a SQL clause that combines the data of two tables based on a common column or condition. JOIN can produce different results depending on the type of join, such as INNER JOIN, LEFT JOIN, RIGHT JOIN, etc.
Question 14
Single choice
An analyst collected data that includes primary account numbers, expiration dates, and service codes. Which of the following data governance classifications is used to describe this data?
-
A
-
B
-
C
-
D
Reveal answer details
Close answer details
Question 15
Single choice
A military commander would like to see the health scorecards of the troops daily and filter them based on gender and rank. Considering this data is PHI, which of the following would be the best way for the commander to view the information?
-
A
-
B
A password-protected dashboard
-
C
A daily printout of a report
-
D
A cloud-hosted spreadsheet
Reveal answer details
Close answer details
Correct answerB
ExplanationA password-protected dashboard is a type of web-based application that can display the health scorecards of the troops in a secure and interactive way. A password-protected dashboard can provide the following benefits for the commander: It can protect the PHI data from unauthorized access or disclosure by requiring a valid username and password to log in. This can ensure that only the commander and other authorized personnel can view the information. It can allow the commander to filter the data based on gender and rank by using drop-down menus, sliders, checkboxes, or other controls. This can enable the commander to customize the view and focus on the relevant dat. It can update the data daily by connecting to a data source that refreshes automatically or on demand. This can ensure that the commander always sees the latest and most accurate information. It can present the data in a visual and intuitive way by using charts, graphs, tables, or other elements. This can help the commander to understand and analyze the data more easily and effectively.
Question 16
Single choice
A marketing analytics team received customer transaction data from two different sources. The data is
complete and accurate; however, the field names appear to be inconsistent. Given the following tables: 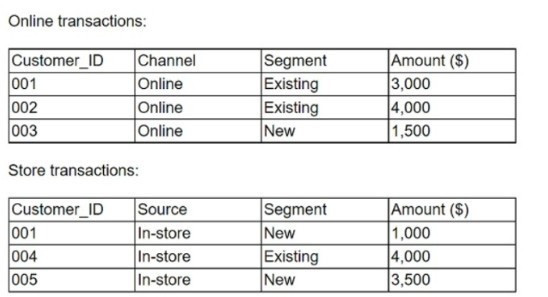 Which of the following is considered best practice if the team wants to consolidate the files and conduct further analysis?
-
A
Standardize the field names.
-
B
-
C
Overwrite the field names in one of the tables.
-
D
Edit the field names in the data dictionary.
Reveal answer details
Close answer details
Correct answerA
ExplanationWhen consolidating data from different sources, it is crucial to standardize field names to ensure consistency across datasets. This process involves aligning the field names so that they are the same in both tables, which simplifies the merging of data and subsequent analysis. Standardizing field names helps in maintaining data integrity and avoids confusion that may arise from having different names for the same data point. Recode the data values (B) would not be necessary unless the data values themselves are inconsistent or in different formats. Overwriting the field names in one of the tables could lead to loss of information or confusion. Editing the field names in the data dictionary (D) is helpful, but it does not address the immediate need to harmonize the field names in the actual datasets. References:
Best practices in data management.
Principles of data integration and consolidation.
Question 17
Single choice
Which of the following will MOST likely be streamed live?
-
A
-
B
-
C
-
D
Reveal answer details
Close answer details
Correct answerA
ExplanationMachine data is the most likely type of data to be streamed live, as it refers to data generated by machines or devices, such as sensors, web servers, network devices, etc. Machine data is often produced continuously and in large volumes, requiring real-time processing and analysis. Other types of data, such as key-value pairs, delimited rows, and flat files, are more likely to be stored in databases or files and processed in batches.
Question 18
Single choice
Given the following data tables: 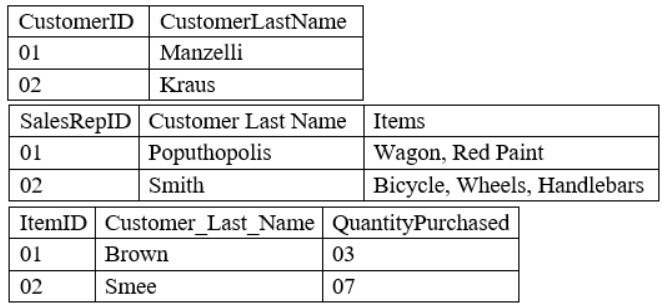 Which of the following MDM processes needs to take place FIRST?
-
A
Creation of a data dictionary
-
B
Compliance with regulations
-
C
Standardization of data field names
-
D
Consolidation of multiple data fields
Reveal answer details
Close answer details
Correct answerA
ExplanationThis is because a data dictionary is a type of document that defines and describes the data elements, attributes, and relationships in a database or a data set. A data dictionary can be used to facilitate the MDM (Master Data Management) process, which is a process that aims to ensure the quality, consistency, and accuracy of the data across different sources and systems. By creating a data dictionary first, the analyst can establish a common understanding and standardization of the data field names, types, formats, and meanings, as well as identify any potential issues or conflicts in the data, such as missing values, duplicate values, or inconsistent values. The other MDM processes can take place after creating a data dictionary. Here is why: Compliance with regulations is a type of MDM process that ensures that the data meets the legal and ethical requirements and standards of the industry or the organization. Compliance with regulations can take place after creating a data dictionary, because the data dictionary can help the analyst to identify and apply the relevant rules and policies to the data, such as data privacy, security, or retention.
Standardization of data field names is a type of MDM process that ensures that the data field names are consistent and uniform across different sources and systems. Standardization of data field names can take place after creating a data dictionary, because the data dictionary can provide a reference and a guideline for naming and labeling the data fields, as well as resolving any discrepancies or ambiguities in the data field names. Consolidation of multiple data fields is a type of MDM process that combines or merges the data fields from different sources or systems into a single source or system. Consolidation of multiple data fields can take place after creating a data dictionary because the data dictionary can help the analyst to map and match the data fields from different sources or systems based on their definitions and descriptions, as well as eliminating any redundant or duplicate data fields.
Question 19
Single choice
The current date is July 14, 2020. A data analyst has been asked to create a report that shows the company's year-over-year Q2 2020 sales. Which of the following reports should the analyst compare?
-
A
-
B
-
C
-
D
Reveal answer details
Close answer details
Correct answerC
ExplanationTo create a report that shows the company's year-over-year Q2 2020 sales, the analyst should compare the sales data from Q2 2020 and Q2 2019. Year-over-year (YoY) analysis is a method of comparing the performance of a business or a financial instrument over the same period in different years. It helps to identify trends, growth patterns, and seasonal fluctuations. Q2 refers to the second quarter of a year, which is usually from April to June. Therefore, the correct answer is C. References:
YoY - Year over Year Analysis - Definition, Explanation & Examples, What is an Annual Sales Report: Definition, metrics, and tips - Snov.io
Question 20
Single choice
Which of the following should be accomplished NEXT after understanding a business requirement for a data analysis report?
-
A
Rephrase the business requirement.
-
B
Determine the data necessary for the analysis.
-
C
Build a mock dashboard/presentation layout.
-
D
Perform exploratory data analysis.
Reveal answer details
Close answer details
Correct answerB
ExplanationExploratory data analysis (EDA) is a process of examining and summarizing a dataset using various techniques, such as descriptive statistics, visualizations, correlations, outliers detection, and hypothesis testing. EDA can help reveal the main characteristics, patterns, trends, and insights from the data, as well as identify any problems or issues with the data quality or structure. EDA is usually performed after understanding a business requirement for a data analysis report and before building a mock dashboard/ presentation layout. Therefore, the correct answer is B. References:
[What is Exploratory Data Analysis? | Definition and Examples], [Exploratory Data Analysis in Python]
Question 21
Single choice
While reviewing survey data, an analyst notices respondents entered "Jan," "January," and "01" as responses for the month of January. Which of the following steps should be taken to ensure data consistency?
-
A
Delete any of the responses that do not have "January" written out.
-
B
Replace any of the responses that have "01".
-
C
Filter on any of the responses that do not say "January" and update them to "January".
-
D
Sort any of the responses that say "Jan" and update them to "01".
Reveal answer details
Close answer details
Correct answerC
ExplanationFilter on any of the responses that do not say "January" and update them to "January". This is because filtering and updating are data cleansing techniques that can be used to ensure data consistency, which means that the data is uniform and follows a standard format. By filtering on any of the responses that do not say "January" and updating them to "January", the analyst can make sure that all the responses for the month of January are written in the same way. The other steps are not appropriate for ensuring data consistency. Here is why: Deleting any of the responses that do not have "January" written out would result in data loss, which means that some information would be missing from the data set. This could affect the accuracy and reliability of the analysis. Replacing any of the responses that have "01" would not solve the problem of data inconsistency, because there would still be two different ways of writing the month of January: "Jan" and "January". This could cause confusion and errors in the analysis. Sorting any of the responses that say "Jan" and updating them to "01" would also not solve the problem of data inconsistency, because there would still be two different ways of writing the month of January: "01" and "January". This could also cause confusion and errors in the analysis.
Question 22
Single choice
A recurring event is being stored in two databases that are housed in different geographical locations. A data analyst notices the event is being logged three hours earlier in one database than in the other database. Which of the following is the MOST likely cause of the issue?
-
A
The data analyst is not querying the databases correctly.
-
B
The databases are recording different events.
-
C
The databases are recording the event in different time zones.
-
D
The second database is logging incorrectly.
Reveal answer details
Close answer details
Correct answerC
ExplanationThe most likely cause of the issue is that the databases are recording the event in different time zones. A time zone is a region that observes a uniform standard time for legal, commercial, and social purposes.
Different time zones have different offsets from Coordinated Universal Time (UTC), which is the primary time standard by which the world regulates clocks and time. For example, UTC-5 is five hours behind UTC, while UTC+3 is three hours ahead of UTC. If an event is being stored in two databases that are housed in different geographical locations with different time zones, it may appear that the event is being logged at different times, depending on how the databases handle the time zone conversion. For example, if one database records the event in UTC-5 and another database records the event in UTC+3, then an event that occurs at 12:00 PM in UTC-5 will appear as 9:00 AM in UTC+3. The other options are not likely causes of the issue, as they are either unrelated or implausible. The data analyst is not querying the databases incorrectly, as this would not affect the time stamps of the events. The databases are not recording different events, as they are supposed to record the same recurring event. The second database is not logging incorrectly, as there is no evidence or reason to assume that. References:
[Time zone - Wikipedia]
Question 23
Single choice
A data analyst has removed the outliers from a data set due to large variances. Which of the following central tendencies would be the best measure to use?
-
A
-
B
-
C
-
D
Reveal answer details
Close answer details
Correct answerD
ExplanationThe median is recognized as the most appropriate measure of central tendency when outliers have been removed from a dataset. This is because the median is less influenced by extreme values compared to the mean. When outliers are present, they can significantly skew the mean, making it an unreliable measure of central tendency. The median, on the other hand, is the middle value of a dataset when ordered from least to greatest and remains unaffected by the extremes.
Therefore, it provides a better representation of the central location of the data after outliers have been excluded. References:
Guidelines for Removing and Handling Outliers in Data.
Mean, Median, and Mode: Measures of Central Tendency.
Which measure of central tendency should be used when there is an outlier?
How are measures of central tendency affected by outliers?
Question 24
Single choice
An analyst needs to join two data sets that compare vehicle weights. One data set is in pounds, and the other has various units of measure. Which of the following should the analyst do first to the data prior to any type of join?
-
A
-
B
-
C
-
D
Reveal answer details
Close answer details
Question 25
Single choice
Which of the following defines the policies and procedures for managing the master data?
-
A
-
B
-
C
-
D
Reveal answer details
Close answer details
Question 26
Single choice
Given the following tables: 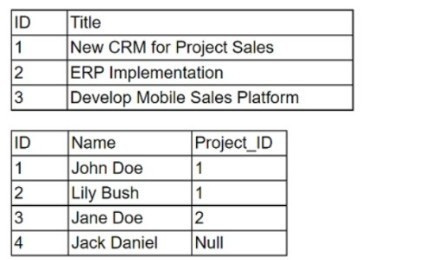 Which of the following will be the dimensions from a FULL JOIN of the tables above?
-
A
Two rows and three columns
-
B
Three rows and four columns
-
C
Four rows and two columns
-
D
Four rows and four columns
Reveal answer details
Close answer details
Correct answerD
ExplanationA FULL JOIN in SQL combines all rows from two or more tables, regardless of whether a match exists.
The result includes all records when there is a match in the joined tables and fills in NULLs for missing matches on either side. Given the two tables in the image, the first table has three rows, and the second table has four rows. The FULL JOIN of these tables will include all rows from both tables, resulting in four rows. Since there are three unique columns in the first table (ID, Title) and three unique columns in the second table (ID, Name, Project_ID), with the common column being ID, the resulting table will have four columns (ID, Title, Name, Project_ID). References:
SQL documentation on FULL JOIN operations.
Question 27
Single choice
A data analyst has been asked to merge the tables below, first performing an INNER JOIN and then a LEFT JOIN: 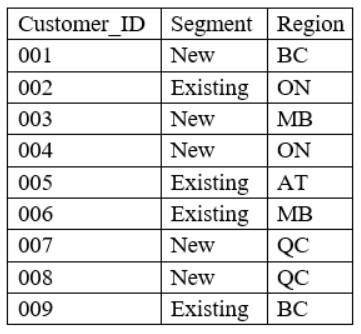 Customer Table In-store Transactions 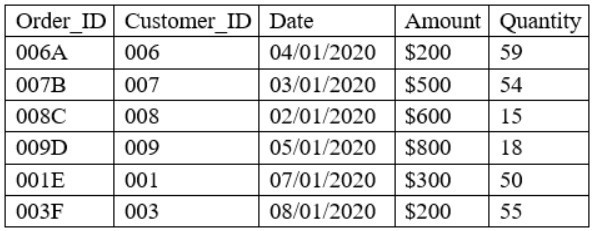 Which of the following describes the number of rows of data that can be expected after performing both joins in the order stated, considering the customer table as the main table?
-
A
INNER: 6 rows; LEFT: 9 rows
-
B
INNER: 9 rows; LEFT: 6 rows
-
C
INNER: 9 rows; LEFT: 15 rows
-
D
INNER: 15 rows; LEFT: 9 rows
Reveal answer details
Close answer details
Correct answerC
ExplanationAn INNER JOIN returns only the rows that match the join condition in both tables. A LEFT JOIN returns all the rows from the left table, and the matched rows from the right table, or NULL if there is no match. In this case, the customer table is the left table and the in-store transactions table is the right table. The join condition is based on the customer_id column, which is common in both tables.
To perform an INNER JOIN, we can use the following SQL query: SELECT * FROM customer INNER JOIN in_store_transactions ON customer.customer_id = in_store_transactions.customer_id;
This query will return 9 rows of data, as shown below:
customer_id | name | lastname | gender | marital_status | transaction_id | amount | date 1 | MARC | TESCO | M | Y | 1 | 1000 | 2020-01-01 1 | MARC | TESCO | M | Y | 2 | 5000 | 2020-01-02 2 | ANNA |
MARTIN | F | N | 3 | 2000 | 2020-01-03 2 | ANNA | MARTIN | F | N | 4 | 3000 | 2020-01-04 3 | EMMA | JOHNSON | F | Y | 5 | 4000 | 2020-01-05 4 | DARIO | PENTAL | M | N | 6 | 5000 | 2020-01-06 5 | ELENA |
SIMSON| F| N|7|6000|2020-01-07 6|TIM|ROBITH|M|N|8|7000|2020-01-08 7|MILA|MORRIS|F|N|9|8000| 2020-01-09 To perform a LEFT JOIN, we can use the following SQL query: SELECT * FROM customer LEFT JOIN in_store_transactions ON customer.customer_id =
in_store_transactions.customer_id;
This query will return 15 rows of data, as shown below:
customer_id|name|lastname|gender|marital_status|transaction_id|amount|date 1|MARC|TESCO|M|Y|1| 1000|2020-01-01 1|MARC|TESCO|M|Y|2|5000|2020-01-02 2|ANNA|MARTIN|F|N|3|2000|2020-01-03 2|
ANNA|MARTIN|F|N|4|3000|2020- 01-04 3|EMMA|JOHNSON|F|Y|5|4000|2020-01-05 4|DARIO|PENTAL|M|
N|6|5000|2020-01-06 5|ELENA|SIMSON||F||N||7||6000||2020-01-07 6||TIM||ROBITH||M||N||8||7000||2020- 01-08 7||MILA||MORRIS||F||N||9||8000||2020-01-09 8||JENNY|| DWARTH||F||Y||NULL||NULL||NULL
As you can see, the customers who do not have any transactions (customer_id = 8) are still included in the result, but with NULL values for the transaction_id, amount, and date columns.
Therefore, the correct answer is C: INNER: 9 rows; LEFT: 15 rows. References:
SQL Joins - W3Schools
Question 28
Single choice
Which of the following is a process that is used during data integration to collect, blend, and load data?
-
A
-
B
-
C
-
D
Reveal answer details
Close answer details
Correct answerB
ExplanationETL is a process that is used during data integration to collect, blend, and load data. ETL stands for extract, transform, and load, which are the three main steps involved in moving data from different sources to a common destination, such as a data warehouse or a data lake. ETL helps to consolidate and standardize data for analysis and reporting purposes. References:
CompTIA Data+ Certification Exam Objectives, page 12
Question 29
Single choice
An analyst needs to conduct a quick analysis. Which of the following is the FIRST step the analyst should perform with the data?
-
A
Conduct an exploratory analysis and use descriptive statistics.
-
B
Conduct a trend analysis and use a scatter chart.
-
C
Conduct a link analysis and illustrate the connection points.
-
D
Conduct an initial analysis and use a Pareto chart.
Reveal answer details
Close answer details
Correct answerA
ExplanationThe first step the analyst should perform with the data is to conduct an exploratory analysis and use descriptive statistics. Exploratory analysis is a type of analysis that aims to summarize the main characteristics of the data, identify patterns, outliers, and relationships, and generate hypotheses for further investigation. Descriptive statistics are numerical measures that describe the central tendency, variability, and distribution of the data, such as mean, median, mode, standard deviation, range, quartiles, etc. Exploratory analysis and descriptive statistics can help the analyst gain a better understanding of the data and its quality, as well as prepare the data for further analysis.
Question 30
Single choice
A customer list from a financial services company is shown below: 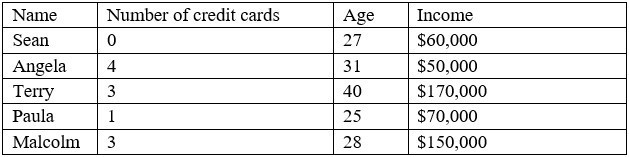 A data analyst wants to create a likely-to-buy score on a scale from 0 to 100, based on an average of the three numerical variables: number of credit cards, age, and income. Which of the following should the analyst do to the variables to ensure they all have the same weight in the score calculation?
-
A
-
B
Calculate the percentiles of the variables.
-
C
Calculate the standard deviations of the variables.
-
D
Reveal answer details
Close answer details
Correct answerD
ExplanationNormalizing the variables means scaling them to a common range, such as 0 to 1 or -1 to 1, so that they have the same weight in the score calculation. Recoding the variables means changing their values or categories, which would alter their meaning and distribution. Calculating the percentiles of the variables means ranking them relative to each other, which would not account for their actual magnitudes.
Calculating the standard deviations of the variables means measuring their variability, which would not make them comparable. References:
CompTIA Data+ Certification Exam Objectives, page 10
Question 31
Single choice
An analyst has been asked to validate data quality. Which of the following are the BEST reasons to validate data for quality control purposes? (Choose two.)
-
A
-
B
-
C
-
D
-
E
-
F
Reveal answer details
Close answer details
Correct answerB
ExplanationIntegrity and D. Consistency. This is because integrity and consistency are two of the best reasons to validate data for quality control purposes, which means to check and ensure that the data is accurate, complete, reliable, and usable for the intended analysis or purpose. By validating data for integrity and consistency, the analyst can prevent or correct any errors or issues in the data that could affect the validity or reliability of the analysis or the results. Here is what integrity and consistency mean in terms of data quality: Integrity refers to the completeness and validity of the data, which means that the data has no missing, incomplete, or invalid values that could compromise its meaning or usefulness. For example, validating data for integrity could involve checking for null values, outliers, or incorrect data types in the data set.
Consistency refers to the uniformity and standardization of the data, which means that the data follows a common format, structure, or rule across different sources or systems. For example, validating data for consistency could involve checking for spelling, punctuation, or capitalization errors in the data set. The other reasons are not the best reasons to validate data for quality control purposes.
Here is why: Retention refers to the storage and preservation of the data, which means that the data is kept and maintained in a secure and accessible way for future use or reference. Retention does not need to be validated for quality control purposes, because it does not affect the accuracy or reliability of the data itself.
Transmission refers to the transfer and exchange of the data, which means that the data is moved or shared between different sources or systems in a fast and efficient way. Transmission does not need to be validated for quality control purposes, because it does not affect the completeness or validity of the data itself. Encryption refers to the protection and security of the data, which means that the data is encoded or scrambled in a way that prevents unauthorized access or use. Encryption does not need to be validated for quality control purposes, because it does not affect the uniformity or standardization of the data itself.
Deletion refers to the removal and disposal of the data, which means that the data is erased or destroyed in a way that prevents recovery or retrieval. Deletion does not need to be validated for quality control purposes, because it does not affect the meaning or usefulness of the data itself.
Question 32
Single choice
A data analyst is developing a data dictionary that aligns with a company's data management processes and policies. Which of the following best describes what should be included in the data dictionary?
-
A
Information containing the links to business data
-
B
Information explaining the business methodologies
-
C
Information containing definitions of the business data
-
D
Information describing the data analysis phases
Reveal answer details
Close answer details
Question 33
Single choice
Joe. an analyst. tests the loading time on a dashboard he is preparing to go live and finds it is slower than he would like. Which of the following must occur to decrease the loading time?
-
A
Deploy the dashboard to production.
-
B
Change the field definitions.
-
C
Update the dashboard subscribers.
-
D
Reveal answer details
Close answer details
Correct answerD
ExplanationOptimizing the dashboard is the process of improving its performance and reducing its loading time by applying various techniques and best practices. Some of the common ways to optimize a dashboard are: Reducing the size and complexity of the data model, such as removing unnecessary columns, aggregating data at the source, or using data compression techniques. Leveraging caching strategies, such as setting appropriate cache refresh intervals or utilizing Power BI's built-in caching mechanisms, to minimize data retrieval delays. Utilizing query folding, direct query, or live connection to enhance data processing efficiency and enable real-time data updates. Optimizing DAX queries, such as avoiding nested calculations, using variables, or simplifying measures, to improve data calculation speed. Reducing visualizations and calculations, such as using fewer or simpler charts, filters, or parameters, to speed up dashboard rendering. Evaluating the impact of custom visuals on dashboard load time and avoiding or replacing those that are slow or inefficient. Applying aggregation and summarization techniques, such as using extract filters, context filters, or level of detail expressions, to reduce the amount of data displayed on the dashboard. Troubleshooting and resolving any issues that may cause slow dashboard load, such as network latency, server overload, or hardware limitations.
Question 34
Single choice
Which of the following is used for calculations and pivot tables?
-
A
-
B
-
C
-
D
Reveal answer details
Close answer details
Correct answerC
ExplanationThis is because Microsoft Excel is a type of software application that allows users to create, edit, and analyze data in spreadsheets, which are composed of rows and columns of cells that can store various types of data, such as numbers, text, or formulas. Microsoft Excel can be used for calculations and pivot tables, which are two common features or functions in data analysis. Calculations are mathematical operations or expressions that can be performed on the data in the cells, such as addition, subtraction, multiplication, division, average, sum, etc. Pivot tables are interactive tables that can summarize and display the data in different ways, such as by grouping, filtering, sorting, or aggregating the data based on various criteria or categories. The other software applications are not used for calculations and pivot tables. Here is why: IBM SPSS is a type of software application that allows users to perform statistical analysis and modeling on data sets, such as regression, correlation, ANOVA, etc. IBM SPSS does not use spreadsheets or cells to store or manipulate data, but rather uses data views or variable views to display the data in rows and columns. IBM SPSS does not have pivot tables as a feature or function, but rather has output views or charts to display the results of the analysis. SAS is a type of software application that allows users to perform data management and analysis using a programming language that consists of statements and commands. SAS does not use spreadsheets or cells to store or manipulate data, but rather uses data sets or tables that are stored in libraries or folders. SAS does not have pivot tables as a feature or function, but rather has procedures or macros that can produce summary tables or reports based on the data. Domo is a type of software application that allows users to create and share dashboards and visualizations that display data from various sources and systems, such as databases, cloud services, or web applications.
Domo does not use spreadsheets or cells to store or manipulate data, but rather uses connectors or APIs to access and integrate the data from different sources. Domo does not have pivot tables as a feature or function, but rather has cards or widgets that can show different aspects or metrics of the data.
Question 35
Single choice
Which of the following is the best description of discrete data types?
-
A
Non-numeric data used to describe attributes of a population sample
-
B
The frequency of the number of times each value occurs by using whole numbers
-
C
Numeric values that can be measured on a continuous scale
-
D
Non-numeric data used to describe attributes of a population sample ranked in a specific order
Reveal answer details
Close answer details
Question 36
Single choice
A business intelligence engineer needs to reduce the size of a data model for reporting purposes. The data set contains more than one million rows, and the table has a date-time column named Date. Which of the following should the analyst do to complete this task?
-
A
Change the data type of the Date column to text.
-
B
-
C
Round the hour of the Date column to the start of the hour.
-
D
Split the Date column into two columns--time and date.
Reveal answer details
Close answer details
Question 37
Single choice
Which of the following is the first step an analyst should perform upon receiving a business request for analysis?
-
A
Determine the data needs and sources for analysis.
-
B
Initiate the analysis for exploratory data analysis.
-
C
Review the business questions to understand the scope.
-
D
Finalize the methodology to solve the problem.
Reveal answer details
Close answer details
Correct answerC
ExplanationAnswer: C. Review the business questions to understand the scope. The first step an analyst should perform upon receiving a business request for analysis is to review the business questions to understand the scope of the problem, the objectives, and the expected outcomes. This will help the analyst to define the analytical approach, identify the data needs and sources, and plan the analysis process. Reviewing the business questions will also help the analyst to communicate with the stakeholders and clarify any assumptions or ambiguities.
Option A is incorrect, as determining the data needs and sources for analysis is not the first step, but rather a subsequent step that depends on the business questions and the analytical approach.
Option B is incorrect, as initiating the analysis for exploratory data analysis is not the first step, but rather a part of the analysis process that involves examining and summarizing the data, identifying patterns and outliers, and testing hypotheses.
Option D is incorrect, as finalizing the methodology to solve the problem is not the first step, but rather a later step that involves selecting and applying the appropriate analytical techniques, tools, and models to answer the business questions.
Question 38
Single choice
Which of the following contains alphanumeric values?
-
A
-
B
-
C
-
D
Reveal answer details
Close answer details
Correct answerD
ExplanationAlphanumeric values are values that contain both letters and numbers, such as A3J7. The other options are numeric values, as they contain only numbers, such as 10.1? 13.6, and 1347. References:
Guide to CompTIA Data+ and Practice Questions - Pass Your Cert
Question 39
Single choice
An analyst needs to determine the appropriate data type for the following sample data: sample data collected: Which of the following data types should be used for this data?
-
A
-
B
-
C
-
D
Reveal answer details
Close answer details
Question 40
Single choice
A database administrator needs to increase performance on a large dimension table. Which of the following is the best way to accomplish this task?
-
A
-
B
-
C
-
D
Reveal answer details
Close answer details
Question 41
Single choice
Given the following data set: 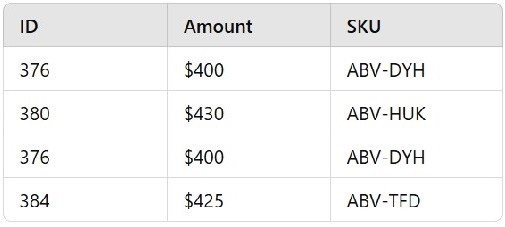 Which of the following is the best reason for cleansing the data?
-
A
-
B
-
C
-
D
Reveal answer details
Close answer details
Question 42
Multiple choice
Which of the following are reasons to create and maintain a data dictionary? (Choose two.)
-
A
To improve data acquisition
-
B
To remember specifics about data fields
-
C
To specify user groups for databases
-
D
To provide continuity through personnel turnover
-
E
To confine breaches of PHI data
-
F
To reduce processing power requirements
Reveal answer details
Close answer details
Correct answersA, B
ExplanationThe reasons to create and maintain a data dictionary are to improve data acquisition and to remember specifics about data fields. A data dictionary is a document or a database that describes the structure, meaning, and usage of the data elements in a data source or a database. A data dictionary can help to improve data acquisition by providing clear and consistent definitions, rules, and standards for the data collection process. A data dictionary can also help to remember specifics about data fields by providing information such as data type, format, length, range, default value, constraints, relationships, etc. The other options are not reasons to create and maintain a data dictionary, as they are related to other aspects of data management or security. A data dictionary does not specify user groups for databases, as this is a function of access control or authorization. A data dictionary does not provide continuity through personnel turnover, as this is a function of documentation or knowledge transfer. A data dictionary does not confine breaches of PHI data, as this is a function of encryption or anonymization. A data dictionary does not reduce processing power requirements, as this is a function of optimization or compression. References:
[What is a Data Dictionary? - DataCamp]
Question 43
Single choice
An analyst needs to join two tables of data together for analysis. All the names and cities in the first table should be joined with the corresponding ages in the second table, if applicable. 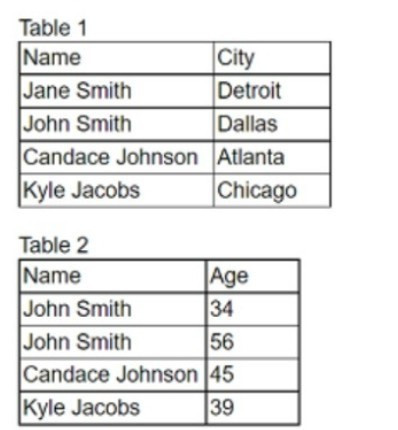 Which of the following is the correct join the analyst should complete.
and how many total rows will be in one table?
-
A
-
B
-
C
-
D
Reveal answer details
Close answer details
Correct answerB
ExplanationThe correct join the analyst should complete is B. LEFT JOIN, four rows. A LEFT JOIN is a type of SQL join that returns all the rows from the left table, and the matched rows from the right table. If there is no match, the right table will have null values. A LEFT JOIN is useful when we want to preserve the data from the left table, even if there is no corresponding data in the right table1 Using the example tables, a LEFT JOIN query would look like this: SELECT t1.Name, t1.City, t2.Age FROM Table1 t1 LEFT JOIN Table2 t2 ON t1.Name = t2.Name;
The result of this query would be: Name City Age Jane Smith Detroit NULL John Smith Dallas 34 Candace Johnson Atlanta 45 Kyle Jacobs Chicago 39
As you can see, the query returns four rows, one for each name in Table1. The name John Smith appears twice in Table2, but only one of them is matched with the name in Table1. The name Jane Smith does not appear in Table2, so the age column has a null value for that row.
Question 44
Single choice
Given the data below: 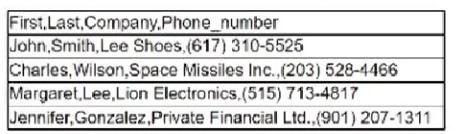 In which of the following file formats is the data presented?
-
A
-
B
-
C
-
D
Reveal answer details
Close answer details
Correct answerB
ExplanationThe data is presented in a CSV (comma-separated values) file format, which is a plain text format that stores tabular data. Each line of the file is a data record, and each record consists of one or more fields separated by commas. The first line of the file usually contains the names of the fields, also known as the header. In this case, the data has four fields: Name, Age, Gender, and Occupation. Therefore, the correct answer is B. References:
CSV File (What It Is & How to Open One), Comma-separated values - Wikipedia
Question 45
Single choice
An analyst in a consumer bank department wants to showcase the concentration of accounts opened in the United States by ZIP Code to describe the effectiveness of the bank's marketing campaigns. Which of the following would be the best way to visualize the data?
-
A
-
B
-
C
-
D
Reveal answer details
Close answer details
Question 46
Single choice
The current date is July 14, 2020. A data analyst has been asked to create a report that shows the company's year-over-year Q2 2020 sales. Which of the following reports should the analyst compare?
-
A
-
B
-
C
-
D
Reveal answer details
Close answer details
Correct answerC
ExplanationYear-over-year (YoY) comparison is a method of evaluating two or more measured events to compare the results at one period with those from a comparable period on an annual basis. For a year-over-year comparison of Q2 2020 sales, the analyst should compare the sales figures from Q2 2020 with those from Q2 2019. This comparison will show the growth, stagnation, or decline in sales over the year and is a common practice in financial analysis to assess performance. References:
SlideTeam's article on sales comparison templates.
Salesforce help article on calculating YoY or Quarter-over-Quarter (QoQ) in reports.
Smartsheet's content on annual sales report templates.
TechRepublic article on creating a YoY comparison chart using a PivotChart in Excel.
Question 47
Single choice
Which of the following is an example of a data-mining ETL tool?
-
A
-
B
-
C
-
D
Reveal answer details
Close answer details
Correct answerA
ExplanationA data-mining ETL tool is a software application that performs extract, transform, and load (ETL) operations on data for data mining purposes. Data mining is the process of discovering patterns, trends, and insights from large and complex data sets. ETL tools help to prepare the data for analysis by extracting data from various sources, transforming data into a consistent and suitable format, and loading data into a data warehouse or other destination. SSIS (SQL Server Integration Services) is an example of a data-mining ETL tool that is part of Microsoft SQL Server. SSIS provides graphical tools and wizards for building and debugging ETL packages that can work with various data sources and destinations.
Therefore, the correct answer is A. References:
[Data Mining - SQL Server Integration Services (SSIS) | Microsoft Docs], [What Is Data Mining? | Oracle]
Question 48
Single choice
A county in Illinois is conducting a survey to determine the mean annual income per household. The county is 427sq mi (2.65q km). Which of the following sampling methods would MOST likely result in a representative sample?
-
A
A stratified phone survey of 100 people that is conducted between 2:00 p.m. and 3:00 p.m.
-
B
A systematic survey that is sent to 100 single-family homes in the county.
-
C
Surveys sent to ten randomly selected homes within 5mi (8km) of the county's office.
-
D
Surveys sent to 100 randomly selected homes that are reflective of the population.
Reveal answer details
Close answer details
Correct answerD
ExplanationSurveys sent to 100 randomly selected homes that are reflective of the population. This is because a random sample is a type of sample that is selected by using a random method, such as a lottery or a computer-generated number, which ensures that every element in the population has an equal chance of being selected. A random sample can result in a representative sample, which means that the sample reflects the characteristics and diversity of the population. By sending surveys to 100 randomly selected homes that are reflective of the population, the analyst can ensure that the sample is representative of the county's households and their income levels. The other sampling methods are not likely to result in a representative sample. Here is why: A stratified phone survey of 100 people that is conducted between 2:00 p.m. and 3:00 p.m. would result in a biased sample, which means that the sample favors or excludes certain groups or elements in the population. By conducting the survey only between 2:00 p.m. and 3:00 p.m., the analyst would miss out on people who are not available or reachable at that time, such as those who are working or sleeping. This could affect the representativeness and generalizability of the sample. A systematic survey that is sent to 100 single-family homes in the county would result in an unrepresentative sample, which means that the sample does not reflect the characteristics and diversity of the population. By sending surveys only to single-family homes, the analyst would ignore other types of households, such as apartments, condos, or mobile homes. This could affect the accuracy and reliability of the sample. Surveys sent to ten randomly selected homes within 5mi (8km) of the county's office would result in a small sample, which means that the sample size is too low to capture the variability and diversity of the population. By sending surveys only to ten homes within a limited area, the analyst would miss out on many households that are located in different parts of the county. This could affect the precision and confidence of the sample.
Question 49
Single choice
Five dogs have the following heights in millimeters: 300, 430, 170, 470, 600 Which of the following is the mean height for the five dogs?
-
A
-
B
-
C
-
D
Reveal answer details
Close answer details
Correct answerB
ExplanationThe mean height for the five dogs is 405mm. The mean, or average, is a measure of central tendency that represents the sum of all values divided by the number of values. To calculate the mean height for the five dogs, we can use the following formula: Mean = (300 + 430 + 170 + 470 + 600) / 5 = 2020 / 5 = 404 We can round up the result to the nearest millimeter, which is 405mm. The other options are not correct, as they are either too high or too low than the actual mean.
Question 50
Single choice
A data analyst is developing a dashboard to track and monitor metrics. Which of the following best practices should be taken into during the FIRST pment process?
-
A
-
B
-
C
Copy a dashboard design from the Internet.
-
D
Reveal answer details
Close answer details
Correct answerA
ExplanationA dashboard is a graphical display that summarizes and presents key performance indicators (KPIs) and metrics for a business or a project. A dashboard should be clear, concise, and easy to understand. To develop a dashboard, one of the best practices is to create a wireframe or a mockup first. A wireframe or a mockup is a low-fidelity sketch or prototype of the dashboard layout and design, which helps to define the scope, requirements, and functionality of the dashboard. Creating a wireframe or a mockup can help to save time and resources, as well as to get feedback from stakeholders and users before deploying the dashboard to production. Therefore, the correct answer is A. References:
[Dashboard Design Best Practices: 4 Key Principles | Toptal], [How to Create an Effective Dashboard (with
Examples) | Tableau]
Question 51
Single choice
A data analyst has a set with more than 40.000 rows in the sample schema below: 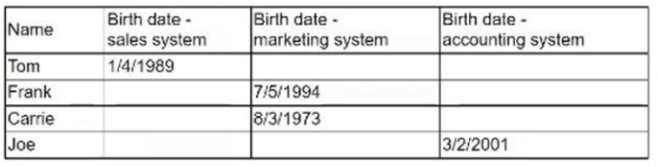 The analyst would like to create one column that contains the customers' birth dates. Which of the following data quality dimensions would BEST explain the reason for compilation?
-
A
-
B
-
C
-
D
Reveal answer details
Close answer details
Correct answerD
ExplanationData integrity is the dimension that measures the consistency and validity of data across different data sources. In this case, the data analyst wants to create one column that contains the customers' birth dates, but the data is stored in different formats and locations in the sample schema. For example, some customers have their birth dates in the customer table, while others have their birth years in the sales table. To compile the data into one column, the data analyst needs to ensure that the data is consistent and valid across the tables. Therefore, data integrity is the best explanation for the reason for compilation. References:
Data Quality Dimensions - DATAVERSITY, The 6 Data Quality Dimensions with Examples | Collibra
Question 52
Single choice
An e-commerce company recently tested a new website layout. The website was tested by a test group of customers, and an old website was presented to a control group. The table below shows the percentage of users in each group who made purchases on the websites: 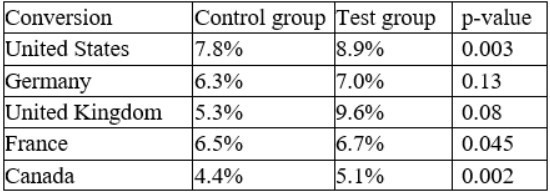 Which of the following conclusions is accurate at a 95% confidence interval?
-
A
In Germany, the increase in conversion from the new layout was not significant.
-
B
In France, the increase in conversion from the new layout was not significant.
-
C
In general, users who visit the new website are more likely to make a purchase.
-
D
The new layout has the lowest conversion rates in the United Kingdom.
Reveal answer details
Close answer details
Correct answerA
ExplanationThe p-value is a measure of how likely it is to observe a difference in conversion rates as large or larger than the one observed, assuming that there is no difference between the groups. A common threshold for statistical significance is 0.05, meaning that there is a 5% or less chance of observing such a difference by chance alone. The table shows the p-values for each country, and we can see that only Germany has a p- value above 0.05 (0.13). This means that we cannot reject the null hypothesis that there is no difference in conversion rates between the test and control groups in Germany. Therefore, the increase in conversion from the new layout was not significant in Germany. For the other countries, the p-values are below 0.05, indicating that the increase in conversion from the new layout was statistically significant.
Option A is correct.
Option B is incorrect because the increase in conversion from the new layout was significant in France (p-value = 0.002).
Option C is incorrect because it does not account for the variation across countries. While the overall conversion rate for the test group (8.4%) is higher than the control group (6.8%), this difference may not be statistically significant when we consider the country-specific effects.
Option D is incorrect because the new layout has the highest conversion rate in the United Kingdom (9.6%), not the lowest. References:
P-value Calculator & Statistical Significance Calculator p-value Calculator | Formula | Interpretation
How to obtain the P value from a confidence interval | The BMJ Confidence Intervals & P-values for
Percent Change / Relative Difference
Question 53
Single choice
You are working with a dataset and want to change the names of categories that you used for different types of books. What term best describes this action?
-
A
-
B
-
C
-
D
Reveal answer details
Close answer details
Correct answerA
ExplanationThe term that best describes the action of changing the names of categories that you used for different types of books is recoding. Recoding is a process of transforming or modifying the values of a variable or a category to make them more meaningful, consistent, or accurate. For example, you can recode the names of book genres from "Fiction", "Non-Fiction", "Biography", etc. to "FIC", "NF", "BIO", etc. to make them shorter and easier to use. References:
Recoding Data - SPSS Tutorials - LibGuides at Kent State University
Question 54
Single choice
Which of the following best describes the process of examining data for statistics and information about the data?
-
A
-
B
-
C
-
D
Reveal answer details
Close answer details
Correct answerC
ExplanationData profiling is the process of examining data for statistics and information about the data, such as the structure, format, quality, and content of the data. Data profiling can help to understand the characteristics, patterns, relationships, and anomalies of the data, as well as to identify and resolve any errors, inconsistencies, or missing values in the data. Data profiling can be done using various tools and methods, such as spreadsheets, databases, or programming languages.
Question 55
Single choice
Which of the following is the BEST reason to use database views instead of tables?
-
A
Views reduce the need for repetitive, complex data joins.
-
B
Views allow for the storage of temporary data. whereas tables do not.
-
C
Views allow for the joining of multiple data sources, whereas tables do not.
-
D
Views can be used to restrict sensitive information.
Reveal answer details
Close answer details
Correct answerA
ExplanationViews are virtual tables that are created by querying one or more base tables or other views. Views do not store any data, but only show the result of a query. One of the main advantages of using views is that they can reduce the need for repetitive, complex data joins. For example, if a query involves joining multiple tables with many conditions, creating a view can simplify the query and make it easier to reuse. Therefore, the correct answer is A. References:
[What is a Database View? | Definition & Examples - Vertabelo], [Database Views - GeeksforGeeks]
Question 56
Single choice
Which of the following is the best reason for removing data outliers?
-
A
Data varies significantly from others.
-
B
Data is redundant in the table.
-
C
Data is duplicated in the whole range.
-
D
Data is missing from the table.
Reveal answer details
Close answer details
|